
I spent eight years running Talent Acquisition inside a large engineering and manufacturing enterprise, 250-plus hires a year. In that time the well-being budget grew every year I was there. The survey scores went the other way.
You know the shape of this already. There is a programme, an assistance line, a mindfulness app licence, and a wellness week that photographs well. There is also an engagement survey telling you your people are exhausted.
Participation sits in single digits. Nobody has asked why. And when someone at the leadership table asks whether any of it worked, the honest answer is that you cannot say.
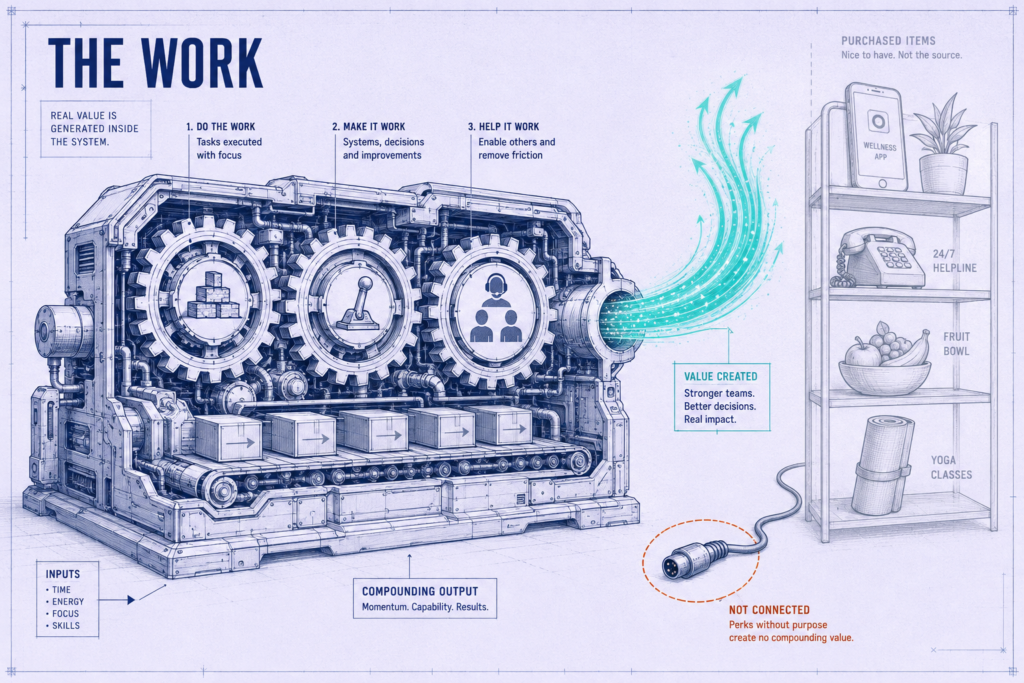
Most organisations treat well-being as something they give employees. It is not.
Well-being is an output, not an offering.
The work either produces it or destroys it. Everything bought afterwards is repair rather than design. That single distinction is what separates the organisations whose numbers move from the ones stuck explaining why theirs have not.
The evidence for that is uncomfortable, and it is not ambiguous.
49% → 21%
The share of employees who strongly agree their organisation cares about their overall wellbeing, 2020 compared with 2024.
Source: Gallup, Employee Wellbeing Strategy: A Practical Guide
Translation: across four years, employers spent more on well-being and lost more than half of the belief that they cared. The provision went up. The belief collapsed underneath it.
HR Insights Lab approach:
This guide does not hand you five strategies to improve well-being. It gives you a diagnostic to run before you spend anything, a design standard to hold the business to, and a measurement set that survives contact with a CFO. Diagnose before you prescribe. Design before you buy.
Here’s what this guide contains:
- The five domains of well-being, ranked by how much of each one you control
- A four-signal test that tells you whether your programme is real or performative
- The load audit you can run this week on data you already hold, with no new platform
- A leading and lagging metric split, and the one-page board view built from it
- A 90-day blueprint that needs no new budget and no new headcount
What Employee Well Being Means (and what it isn’t)
Employee well-being is the combined physical, mental, financial, social, and career health of a workforce, shaped primarily by working conditions rather than by benefits. It is a state that the work produces. When workload, autonomy, and management quality hold up, well-being follows. When they do not, no benefit corrects it.
That definition is where most organisations stop. It is also where the useful work begins, because three words get used interchangeably in leadership meetings and they do not mean the same thing.
Here’s the difference:
Wellness is the activity: the app, the webinar, the step challenge. Well-being is the state those activities are supposed to influence. Employee engagement is something else entirely, and conflating it with well-being is the most expensive vocabulary error in this category.
Engagement measures how invested someone is in the work. Well-being measures what the work is doing to them. Those two readings move together often enough that most dashboards treat them as one number, which is precisely why the warning signs get missed.
You can have high engagement and collapsing well-being. That combination is the most dangerous reading on your dashboard.
The people who care most are usually the ones absorbing the most. They stay late because the work matters to them, and the survey reads them as your strongest team right up until two of them resign in the same month.
Four things employee well-being is not
It is not perks. Free lunch does not survive contact with a 60-hour week, and a perk signals intent rather than changing conditions. That distinction matters at budget time, because intent is cheap and conditions are not.
It is not an employee assistance programme. An assistance line is a repair service, and a good one is worth having. Well-being is the design work that reduces how often repair is needed.
It is not happiness. People under real strain can still be thriving when the work has meaning and the load is shared fairly. People can also be comfortable, unbothered, and completely hollowed out.
And it is not an HR programme. The three variables that move it most are workload, autonomy, and manager quality, and not one of them sits inside HR’s direct control. That is the reason HR’s job here is to influence the system rather than run the activities.
The old way
- Treat well-being as a benefits category owned by Total Rewards
- Accept the brief as written: “can HR run a wellness week?”
- Buy the tool, announce the launch, report the launch
- Own the outcome without owning any of the inputs
The Lab Way
- Treat well-being as an output of job design, workload, and management quality
- Reframe the ask upward: diagnose the conditions before scheduling the activity
- Own the diagnosis and the design standard; hand the conditions to the business in writing
- Report belief and load, not attendance
I hold a position on this that irritates people, and eight years of watching it play out has not softened it. Well-being problems are mostly systems failures, not benefits failures, in exactly the way that retention is a systems problem rather than a compensation one. The organisations that learn this cheaply are the ones that check the conditions before they check the catalogue.
◆ PRO TIP
Real talk: HR cannot fix a workload problem with a subscription. If the honest diagnosis is that three teams are carrying 130% of a sustainable load, every pound spent on provision is a pound spent making the organisation feel better about not fixing it. Say that out loud early, in writing, before the procurement conversation starts. It is much harder to say afterwards.
The Care Gap: Why well-being scores collapsed while budgets grew
Between 2020 and 2024, well-being spend rose across almost every enterprise HR function I had visibility into. Benefits teams added headcount. Apps were licensed, mental health days were introduced, and awareness campaigns ran on a calendar.
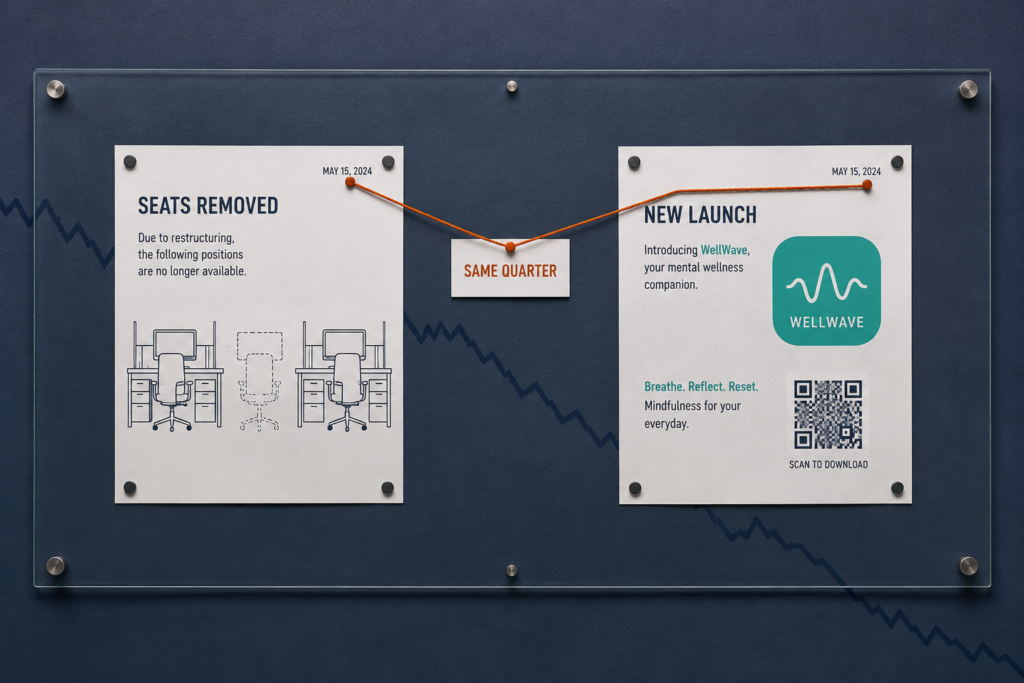
Belief went the other way, and it did not drift. It halved.
Why this happened:
Employees judge intent by conditions, not by offerings. A meditation licence issued in the same quarter as a hiring freeze reads as a message, and it is not the message HR intended to send. People are extremely good at reading sequence.
◆ FROM THE LAB
My experience: in eight years I watched well-being budgets survive cost-cutting rounds that cut headcount. Not once did anyone on the floor fail to notice. The team that lost two colleagues in a restructure and gained a wellness portal the following month drew the correct conclusion about what the organisation was willing to protect, and no communications plan has ever talked a workforce out of a conclusion they reached from evidence.
Carewashing, and how to test for it
Carewashing is visible investment in well-being support alongside untouched root causes. It is not a moral failure and it is rarely cynical. It is what happens when a function is handed accountability for an outcome and given control of only the visible part of it.
You can test for it this week, in your own systems, without asking anyone for budget.
- Programme utilisation is under 10% and nobody has formally asked why. Pull the access route yourself and count the clicks it takes.
- The well-being budget is protected while headcount is not. Check which line survived the last two planning rounds.
- The well-being survey contains no question about workload. Open the instrument and search it.
- No manager’s objectives contain a well-being outcome. Sample ten objective sets and read them.
Every one of those is a lookup, not an opinion. That matters, because it lets you raise the issue with evidence rather than with a feeling, and a Head of People armed with four system facts is much harder to wave off than one armed with a concern.
Here is the hard version of the argument. A programme employees do not believe in costs more than no programme at all, because it converts goodwill into cynicism, and cynicism is the one thing you cannot buy back.
The old way
- Measure well-being by what you offered
- Launch the programme, publicise it, report the launch
- Treat low utilisation as an awareness problem
The Lab Way
- Measure it by what employees believe about why you offered it
- Fix the two conditions generating the most complaints, then say nothing until the numbers move
- Treat low utilisation as a diagnosis of the offer, the access, or the relevance
The same discipline that governs HR tech buying decisions applies here. I treat every platform as a co-pilot rather than a decision-maker: it can accelerate access to support, and it cannot decide whether the work is survivable. Any vendor conversation that blurs that line is selling you a substitute for a decision you still have to make.
⚠ WATCH OUT
Common mistake: launching a well-being platform in the same quarter as a hiring freeze. The sequence is what gets read, not the intent. If both are unavoidable, separate them in time and name the constraint openly rather than letting people construct their own explanation, because the one they construct will be less generous than the truth.
Naming the gap is not the same as closing it. To close it you need to know which domain is failing, and that requires a model with a ranking rather than a list.
The Five Domains of Employee Well-Being (and the one you can control)
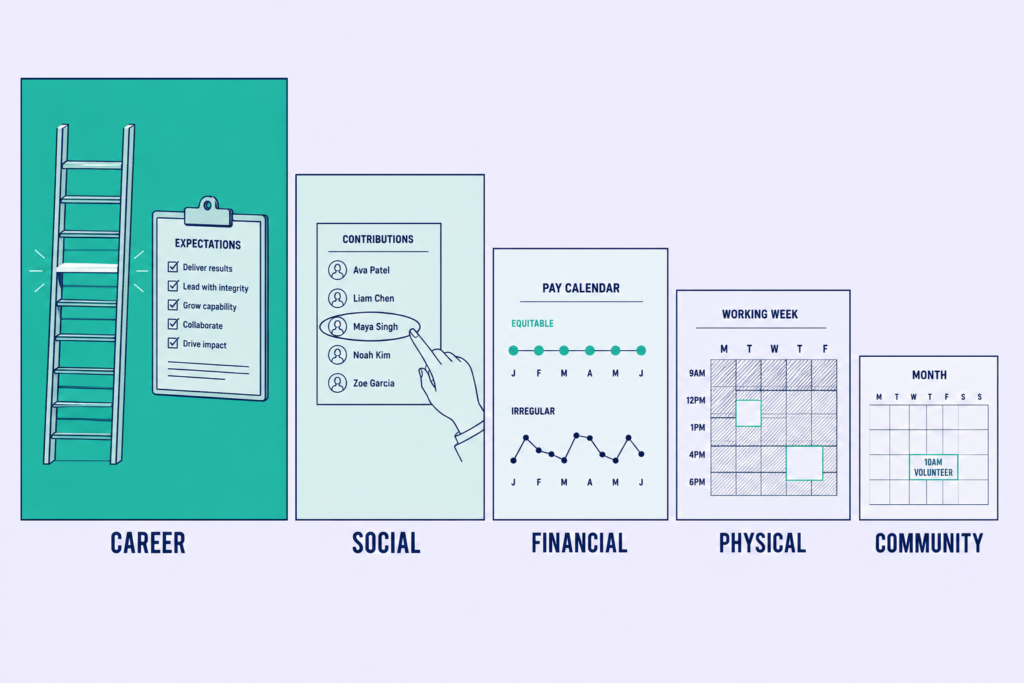
Five domains show up in every serious model of well-being: career, social, financial, physical, and community. That part is settled. What almost nobody tells you is that they are not equal, and treating them as equal is how well-being budgets end up in the domain with the best suppliers rather than the domain with the most leverage.
They are presented here in order of employer control. Fund them in that order.
Career well-being: the domain you own
Career well-being is whether people like what they do with their days, and whether they can see where it leads. It is the strongest predictor of overall life evaluation and the only domain the employer designs almost entirely.
Three levers move it. Role clarity, meaning the person knows what good looks like this quarter and it exists in writing. Visible progression, meaning there is a named next role and a named skill gap between here and there.
The third is work worth doing, which comes down to whether the person can see where their output lands. This is where internal mobility programme design and skills-based progression frameworks stop being talent processes and start being well-being infrastructure.
The failure mode is quiet. People do not complain about a stalled path. They leave for one.
◆ FROM THE LAB
The Sofia test: when I ran a First Look policy giving internal candidates a head start on every open role, 23% of hires that year came from inside. Time-to-Productivity for those hires was 28 days, against 67 days for external ones. Career well-being and operational performance were not two competing budgets. They were the same investment, and the finance case wrote itself.
Social well-being: Connection, Belonging and Mattering
Social well-being is about specific relationships and specific recognition, not values on a wall. Here is where I break with most of the writing on this topic: belonging is a poor design target because it is a feeling, and you cannot engineer a feeling directly.
Mattering is designable, because it has observable inputs. Being asked. Being credited by name for a specific contribution. Being consulted before a decision that affects you, rather than informed after it.
For distributed and hybrid teams that means structured connection with a named owner and a slot in the calendar, not an open invitation nobody accepts. The failure mode is a recognition programme that rewards volume and visibility, which makes quiet high performers feel less seen rather than more.
Democratic recognition programmes distribute effort. They do not distribute meaning.
◆ FROM THE LAB
My experience: earlier in my career I inherited a referral programme that was technically healthy and practically dead. Everyone could participate, most people did once, and the conversion rate sat at 31%.
So I stopped treating it as a campaign and looked at who was good at it. A small group, roughly the top 5 to 10% of referrers, were producing the overwhelming majority of successful hires. We gave that group a name, quarterly time with the hiring leadership, early sight of roles, and a genuine say in how we described the work.
One senior engineer referred 11 people. Nine were hired. Eight were still with the organisation when I last checked, conversion across that group ran at 82% against a company average of 31%, and we avoided roughly ₹40 lakhs in agency fees.
The incentive was not what changed. What changed was that a small group of people were treated as though their judgement mattered, and they responded by giving us their judgement. That is a mattering result that happened to arrive with a recruiting number attached, and the same asymmetry governs employee recognition programmes and employee referral programme design alike.
Financial well-being: Stability, not salary
Financial well-being is economic security, and organisations reduce it to one variable almost every time. Pay level matters up to a threshold. Past that threshold, financial stress is driven by volatility rather than by insufficiency.
Variable shift patterns. Delayed reimbursements. Opaque bonus mechanics, relocation costs carried by the employee, and no stated timing between a promotion and the pay rise that follows it.
Every one of those is cheaper to fix than base pay. Predictable pay dates, transparent bands, faster expense turnaround, and guidance at the big life events do more for financial stress in most organisations than a market correction does.
The old way
- Read financial stress as underpayment
- Run a market correction across the population
- Inflate fixed cost and hope the signal lands
The Lab Way
- Read financial stress as unpredictability first
- Fix cycle timing, transparency, and reimbursement speed
- Then check the compensation benchmarking and correct where it is genuinely wrong
The mainstream advice says higher salaries solve retention. They do not, and I have watched three organisations prove it at considerable expense. Pay-led retention inflates fixed cost, creates internal inequity between the people who negotiated and the people who did not, and loses the same people anyway once the novelty of the raise wears off, which is a pattern anyone who has read their own exit data will recognise from why people resign.
◆ PRO TIP
The catch: none of this applies if you are genuinely below market. Run the benchmark before you run this argument, because using a systems explanation to avoid a pay problem is the fastest way to lose the trust of the people you are trying to keep.
Physical well-being: Energy, not gym membership
Physical well-being at work is mostly a function of recovery rather than of fitness provision. The employer controls four inputs, and a gym subsidy is not among them.
Hours pattern and its predictability. Meeting load and the density of the calendar. Genuine leave use, meaning the gap between leave booked, leave taken, and leave interrupted. And the physical and psychological safety of the environment itself.
Here’s how to build it:
Pull average leave utilisation and after-hours system activity by team, not by organisation. Then read the two together, because low leave utilisation combined with high after-hours activity is the signature you are looking for. Any recommendation you make about rest periods or leave entitlement should be checked against local law before it becomes policy, since leave policy design is jurisdiction-dependent.
I learned this running a hiring campaign rather than a wellness one. When we introduced batch interviewing and daily stand-ups to protect interviewer capacity, recruiter productivity rose about 35% and the load became survivable at the same time, which told me load design and well-being were never separate projects.
⚠ WATCH OUT
Anti-pattern: reporting leave utilisation as a company average. The average is always survivable. It is built from the teams coasting and the two teams drowning, and reporting it at organisation level is how the drowning teams stay invisible for another quarter.
Community Well-Being: Contribution beyond the job
Community well-being is the connection to something larger than the role: place, purpose, contribution. Two levers work. Volunteering time that is genuinely protected in the calendar rather than nominally granted, and purpose-linked work that connects a person’s output to a visible outcome.
It belongs in the model. For a subset of the workforce, particularly in mission-driven and engineering environments, it is the reason they stay. It is also the domain with the weakest employer leverage and the highest ratio of communication to impact.
◆ PRO TIP
The honest downside: community initiatives generate the most internal communication and the least measurable movement of anything in this model. If your attention and budget are limited, sequence this domain last. When you do fund it, protect the time in the calendar or do not announce it, because an unprotected volunteering day is a promise employees will test once and then stop believing.
Ranking the domains tells you where to spend. It does not yet tell you what the failure is costing you, and no leadership team funds a diagnosis without a number attached to the problem.
What Poor Employee Well-Being Costs You
Most well-being business cases fail in the same place. They open with an industry ROI multiple from a vendor deck, and the CFO asks where the number came from. Nobody in the room can answer, and the credibility of everything that follows drops.
Build the number yourself instead. You already hold every input.
Here’s how to build it:
- Attrition cost. Replacement cost plus lost productivity across the vacancy and the ramp. Your cost per hire figure and your average ramp time give you both halves.
- Presenteeism. People present and producing at reduced capacity. This is the largest component and the least measured one, so estimate it openly rather than omitting it.
- Absence. The visible tip, and usually the only line already tracked properly.
- Opportunity cost. The proposals that never got written because nobody had the capacity to think. Name it even if you cannot price it.
The presenteeism line is where every model I have seen gets abandoned, because it feels unquantifiable. It is not. Reason by analogy from a number you already defend.
◆ FROM THE LAB
The Sofia lens: I have used the same operational benchmark for years. An unfilled senior engineering role drains roughly $500 a day, which makes a 60-day vacancy a $30,000 hole in productivity before anyone argues about recruiting spend.
Now apply that logic honestly. If an empty seat costs $500 a day, a seat occupied by someone running at 60% is not free. It is simply unbilled, and it does not appear anywhere in your reporting.
Four lines, populated from your own data, with your own assumptions stated. That is a model a finance audience can interrogate, which is the only kind worth presenting. External research then does one job and one job only: it shows the direction is not unique to you.
$11.7 trillion
The global economic value that improving employee health and well-being could release. Of more than 30,000 employees surveyed worldwide, only 57% reported good holistic health.
Source: McKinsey Health Institute with the World Economic Forum, Thriving Workplaces, 2025
Translation: 43 in every 100 of your people are operating below their own baseline right now, and the macro number tells you the effect is systemic rather than a quirk of your organisation. Use it as context. Never use it as the case.
Well-being is an attrition signal, not an attrition cure
Be careful with the causal claim here, because an HR Leader who overstates it once does not get a second hearing. Well-being programmes do not retain people on their own. Declining well-being is one of the earliest observable signals that people are preparing to leave, and it shows up months before the resignation does.
That is a more useful claim anyway. Prediction beats correlation when you are deciding where to send help.
Why this works:
You can see it in data you already hold. Rising after-hours activity in a team. Falling leave utilisation. Shrinking internal application rates from a specific function, and a drop in referral volume from people who used to refer constantly, which is the signal I trust most because it is the first thing an unhappy employee quietly stops doing.
Read alongside your exit interview data and standard attrition analysis, those four inputs will tell you which team is about to lose someone. Where people analytics is heading is exactly this shift: from predicting what to hire toward predicting who is likely to leave, using engagement and performance trends to intervene before the conversation happens rather than after.
The external evidence supports the direction, and it is worth putting in front of a board.
65%
Employees thriving in their wellbeing are 65% less likely to be actively watching for or seeking a new job, and 46% less likely to experience frequent burnout. Burnout-related turnover and lost productivity are estimated to cost organisations $322 billion globally each year.
Source: Gallup, Employee Wellbeing Strategy: A Practical Guide
Translation for your own planning: 65% less likely to be job-seeking is not a wellness outcome. It is a pipeline outcome. Work out what it does to your replacement hiring volume next year and you have converted a well-being argument into a headcount forecast, which is a language the business already speaks.
◆ PRO TIP
Real talk: a thriving employee in a role with no future still leaves. Well-being is necessary and insufficient, and anyone who tells you a well-being programme reduces turnover by a specific percentage is selling something. Claim the prediction, not the cure. It is the claim you can defend twelve months later.
You now have a cost model and a ranking. What you do not yet have is evidence about your own organisation, and prescribing before diagnosing is the single most common failure in this category.
Employee Well-being Diagnostic: How to find out what’s broken
Almost every article on this topic jumps from why well-being matters straight to strategies for improving it. That sequence is backwards. You would not restructure a function on a hunch, and a well-being programme built without a diagnosis is exactly that.
Diagnosis here costs nothing. It is the highest-return week of work available to you.
Build a listening architecture, not another survey
A survey is an event. A listening architecture is a system with four inputs running continuously, and the difference between them is the difference between finding out in March and finding out all year.
The implementation:
- A short quarterly pulse with a fixed core question set. Fixed matters more than clever, because comparability is the whole point.
- Operational data you already hold: leave utilisation, after-hours activity, internal mobility applications, absence, and overtime.
- Structured exit and stay interviews using a consistent question set, so the answers can be counted rather than just read.
- Manager-level qualitative feedback captured in a comparable format, not as free-text nobody analyses.
The second input is the one to build first. Operational data is unbiased by survey fatigue, it is not filtered through what people think you want to hear, and it already exists. One owner, one cadence, one place all four inputs land.
This is the same principle behind Intelligence-Led Sourcing, the framework I use in Talent Acquisition: continuous market mapping before vacancies arise, so that when demand appears you are activating a pipeline rather than starting one. Transfer it directly. The organisations that respond well to well-being problems are the ones already listening before the problem becomes visible.
The old way
- Run the annual survey
- Wait ten weeks for the report
- Launch initiatives against the lowest-scoring question
- Repeat next year and wonder why the score moved 0.1
The Lab Way
- Run four continuous inputs with one named owner
- Treat the survey as one input, not the system
- Act on the team where the variance is, monthly
- Improve survey design only after the operational data tells you what to ask
The four questions that tell you more than a 40-item survey
Most engagement instruments produce a report where every item scores between 3.1 and 3.8 and nothing is actionable. Four questions, asked consistently and reported by team, will outperform all forty. The constraint is the value.
1
“Is your workload sustainable at this level for the next six months?”
This detects load, the variable most well-being surveys omit entirely. A bad answer here outranks everything else on the instrument, because load is the input that breaks the other four domains. First response: go to the team’s intake, not to the individual.
2
“Do you know what good performance looks like in your role this quarter?”
This detects role clarity, which is the cheapest thing on this list to fix. A bad answer usually means the manager holds the standard in their head and has never written it down. First response: one written page per role, this month, no process redesign required.
3
“If you had a problem affecting your work, would you raise it with your manager?”
This detects psychological safety without ever using the term, which is deliberate. Naming the concept in the question teaches people the answer you want. A bad answer means the escalation route needs to exist somewhere other than the reporting line.
4
“Does anything stop you taking leave you are entitled to?”
This detects the gap between policy and practice, which is where most organisations quietly lose their recovery capacity. A bad answer is almost never about the policy. First response: look at cover arrangements and at what happened to the last person who took two consecutive weeks.
Report every one of them by team. I learned the cost of averages in a completely different domain: when we worked on pipeline diversity, nothing improved while we watched the headline ratio, and the movement only came once we examined slate composition at each individual stage. Averages hide the problem in whatever domain you apply them to.
⚠ WATCH OUT
Common mistake: reporting well-being scores at organisation level. The average always looks survivable. It is the arithmetic of comfortable teams cancelling out drowning ones, and it is the reason a Head of People can present a stable dashboard in the same quarter that two functions quietly fall apart.
Read the data you already have: the load audit
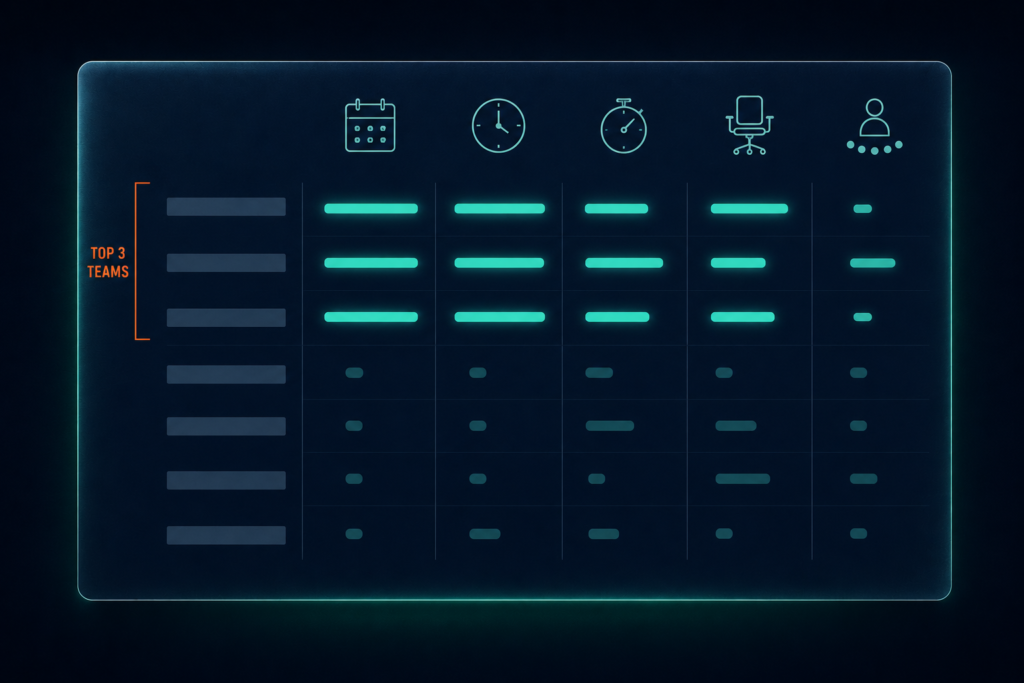
You do not need a listening platform to find out where the pressure is. You need five pulls and an afternoon.
- Leave utilisation, by team
- After-hours system activity, by team
- Overtime, by team
- Open vacancy duration, by team
- Span of control, by manager
Now read the patterns rather than the individual numbers. Low leave utilisation plus high after-hours activity is the classic pre-attrition signature. A team carrying a six-month vacancy has a well-being problem disguised as a hiring problem, and a manager with 14 direct reports cannot deliver the manager behaviours the rest of this guide depends on.
Rank teams by combined load signal. Intervene on the top three. Not on the organisation.
⚠ WATCH OUT
Warning: this is team-level aggregate analysis only. Individual-level activity monitoring destroys the trust the entire exercise depends on, and in the UK and EU it carries real employee-monitoring and data protection exposure. Set the aggregation threshold before you pull the first report, state it publicly, and route the design past your employment counsel rather than past your analytics vendor.
◆ FROM THE LAB
Real implementation: the sharpest lesson I have on load design came from a hiring campaign, not a well-being programme. The business needed somewhere between 350 and 500 people across customer support, operations, junior engineering, and sales support, and it needed them inside eight to twelve weeks to hit a ramp-up date that was not moving.
The instinct in that situation is to push harder. We did the opposite and designed the load before it arrived. Weekly hiring targets were mapped backward from the business start date, and recruiter bandwidth and interviewer availability were forecast explicitly rather than discovered in week four. Screening was standardised, interviews were batched, scorecards were structured, and every candidate batch had a single point of contact.
Governance ran on a daily recruiter stand-up and a weekly war room with hiring managers. We delivered 420-plus hires in 10 weeks. Turnaround Time fell from 32 days to roughly 18 to 20, offer-to-join held above 90%, and 90-day retention landed at 85 to 88%, in line with historical benchmarks. Recruiter productivity rose about 35%.
The number I care about most in that list is the last one. Productivity rose because the load was engineered rather than absorbed, and the team that ran the campaign came out of it intact. That is the transferable point: the same forward load-modelling that makes a hiring campaign survivable makes any team’s quarter survivable, and it is capacity planning work rather than well-being work.
The diagnostic tells you which teams are under pressure and why. What it cannot tell you is what to change, and the answer to that sits inside the work itself rather than alongside it.
Design well-being into the work, not around it
This is the argument the rest of the guide hangs on. Well-being at work is produced by job design, workload, and management quality, and those three sit inside the work. Everything provided alongside the job is operating downstream of them.
Which is why the interventions in this section cost management attention rather than money. That makes them cheaper and considerably harder.
Autonomy and job design: the highest-return change nobody budgets for
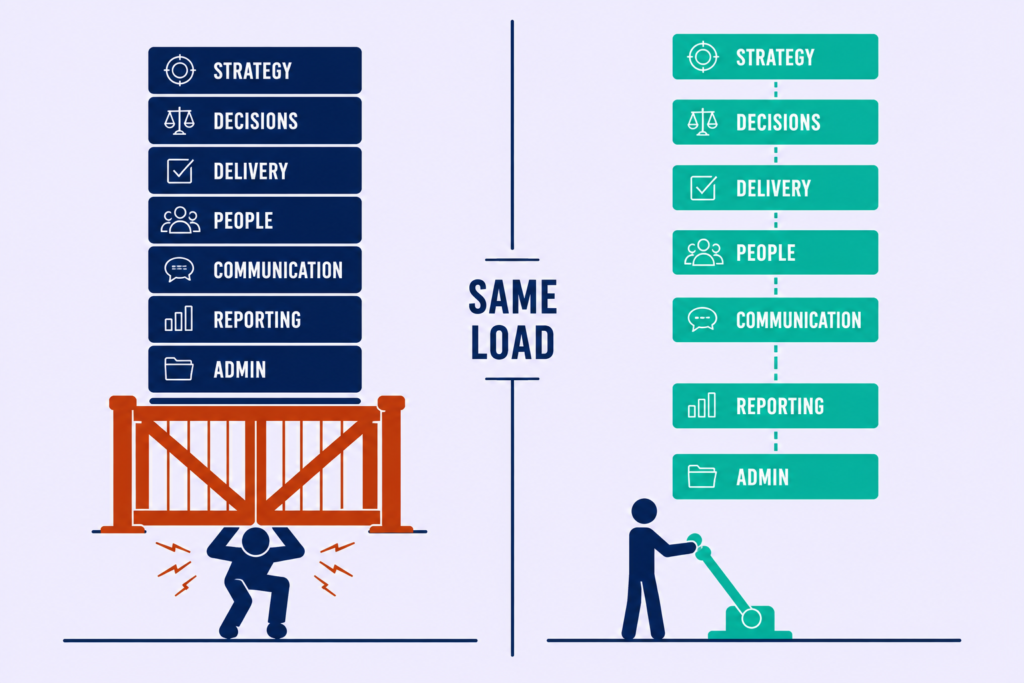
The mechanism is straightforward and it is well established. Demand without control produces strain. The same demand with control produces engagement, which means the volume of work is frequently not the variable you need to change.
Here’s the deal:
Push decision rights down to the level where the information already is. You will be told this creates risk. The honest answer is that it moves risk from a slow approval chain to a fast informed one, and you can name the decisions that stay escalated.
Protect meeting-free blocks properly, which means someone senior defends them when a stakeholder wants the slot. Give people a route to decline low-value work with a named escalation path, because a right to refuse without an escalation path is not a right, it is an invitation to be difficult alone.
And allow genuine role design customisation, letting people shape a portion of the role toward what they are good at. Autonomy fails in one predictable way: it gets granted while every approval step that contradicts it stays in place.
The old way
- Reduce stress by offering resilience training
- Teach individuals to cope with the design
- Measure attendance at the session
The Lab Way
- Reduce strain by increasing control
- Change the design, then support the individual
- Measure decision latency and protected time
Resilience and mindfulness training place the burden of a design problem on the individual carrying it. I am not against either as support. I am against either as a primary intervention, and the distinction is not academic when you are allocating a fixed budget.
My clearest example of good job design comes from automation rather than from well-being work. When we introduced AI in recruitment workflows, the gains did not come from replacing anyone. They came from removing the high-volume, low-judgement tasks that had been crowding out the parts of the job that needed a person.
AI doesn’t replace recruiters. It replaces the parts of the job that stopped recruiters from being effective in the first place.
That principle generalises to any function. Look at what is crowding out the judgement work in a role, remove it, and the well-being outcome and the performance outcome arrive together.
Workload Architecture: Make the load visible before you make it fair
Every organisation I have worked in had an overload conversation that ended in sympathy rather than in a decision. Sympathy is free, which is why it is the default. Four steps convert it into a mechanism.
1
Make the load visible
A shared view of what each team is currently carrying, refreshed monthly and owned by a named person. Not a project tracker. A capacity view that shows commitments against available weeks, which is the only version that makes a trade-off obvious to someone outside the team.
2
Name the ceiling
An explicit statement of what the team will not take on, agreed with the business rather than with HR. This is where most organisations fail. They add capacity language to the culture deck and then never say no to a stakeholder, and the ceiling that is never enforced is not a ceiling.
3
Build the intake gate
New work enters through a single point, with a stated trade-off attached: if this comes on, what comes off. The gate protects the boundary at the place work enters, so no individual has to defend it alone in a meeting where they are outranked.
4
Design the peak
For known cyclical ramps, plan capacity backward from the deadline instead of absorbing it forward from today. This is exactly the bulk hiring capacity planning method described earlier: weekly targets mapped back from the business start date, bandwidth forecast in advance, and vendor delivery tracked against a stated SLA rather than a hope.
⚠ WATCH OUT
Anti-pattern: publishing a workload principle without giving anyone authority to enforce it. A stated ceiling with no arbitrator is worse than no ceiling, because it tells the team the organisation understood the problem and chose not to resource the solution.
Protection from harm: The foundation everything else sits on
The US Surgeon General’s Framework for Mental Health and Well-Being in the Workplace sets out five essentials: protection from harm, connection and community, work-life harmony, mattering at work, and opportunity for growth. Protection from harm is placed first deliberately. It is the precondition for the other four, not the first item on a list.
How to execute:
- Physical safety, treated as an operating standard rather than an annual audit
- Psychological safety, measured through behaviour and escalation data rather than through a survey item
- A functioning route for raising harassment and bullying that does not run through the person’s own manager, which is the single most common design flaw in a workplace harassment policy
- Adequate rest between shifts, checked against local working time law before it is written into policy
- Normalised leave use, evidenced by what happens when someone takes two consecutive weeks
Here is the practitioner argument competitors miss. That framework is public, free, and government-issued, which makes it the most defensible external structure available when a governance forum asks whose model you are using.
I structure programmes against public frameworks rather than supplier models for one reason. A vendor framework always has a product at the end of it, and the moment a governance committee notices that, your evidence and their catalogue become the same conversation.
Source: US Surgeon General’s Framework for Mental Health and Well-Being in the Workplace
◆ PRO TIP
Lab Note: everything in this section addresses organisational design, not individual care. Where an employee is experiencing ill health, statutory duties around reasonable adjustments and accommodations may apply, and that is a conversation to route through your employment counsel rather than through your well-being programme.
Design decisions do not implement themselves. Every intervention in this section reaches an employee through one person, and that person is the most overlooked variable in the entire model.
The Manager Layer: Your Single Highest-leverage Well-being Investment

Autonomy, workload, leave normalisation, psychological safety. Every intervention in the previous section is delivered or blocked by one person, and that person is the line manager.
That makes the manager layer the delivery mechanism for the whole programme rather than one initiative among several. It also means an under-resourced manager population caps the return on everything else you fund.
Why does this matter?
Four behaviours carry almost all of the effect, and each one has an observable definition. Setting expectations in writing, so the standard exists outside the manager’s head. Protecting the team’s load at the intake gate, which means saying no upward rather than absorbing downward.
Modelling recovery, meaning they take leave and they do not send messages at midnight. And noticing change early enough to ask about it, which is the only one of the four that cannot be mandated into existence.
- Fewer direct reports. Everything below this line is theoretical at a span of 14.
- A script for the difficult conversation, written and rehearsed, not improvised at the point of need.
- A clear boundary on what they should not attempt to handle themselves, stated explicitly.
- A route to escalate that resolves in days rather than in the next quarterly cycle.
None of it holds unless a well-being outcome sits inside the manager’s own objectives. Until it does, you are asking for discretionary effort on something the organisation has declined to measure them on.
The old way
- Run mental health awareness training for managers
- Measure attendance and completion
- Distribute the enablement budget evenly across everyone
The Lab Way
- Reduce span of control first, then train
- Put a well-being outcome in the objectives and measure the behaviour
- Concentrate manager enablement spend where the population is
The evidence that this leverage is real, rather than a convenient framing, is unusually direct.
69%
Of employees say their manager has the greatest impact on their mental health, level with the influence of a spouse or partner at 69%, and ahead of a doctor at 51% or a therapist at 41%. 60% said their job was the single largest factor in their mental health.
Source: The Workforce Institute at UKG, global study of 3,400 people across 10 countries, 2023, reported by SHRM
Translation for a budget conversation: the manager layer is not one lever among many. It is the lever, and a limited enablement budget spread thinly across every people leader in the organisation is a budget spent on visibility rather than on effect.
◆ FROM THE LAB
The Sofia lens: I found the same concentration pattern in referrals, where 5 to 10% of employees generated 60 to 70% of successful hires. The pattern I found in referrals holds in management. A small number of managers determine the well-being experience of most of your workforce.
Identify them using your own load audit rather than your performance ratings, because the two lists are not the same. Then resource that group properly and stop distributing the training budget evenly across everyone. Even distribution feels fair and produces nothing.
⚠ WATCH OUT
Common mistake: treating awareness training as the intervention. Awareness changes what a manager knows. It does not change a span of 14, an unclear escalation route, or an objective set with no well-being outcome in it. Mental Health First Aid certification has a place as a support layer, and it is not a substitute for fixing the conditions the manager is working inside.
Manager well-being is the bottleneck you are not measuring
Here is the part most well-being strategies skip. Managers are being asked to absorb the well-being load of their teams while their own goes unmeasured, and in most reporting it is completely invisible.
The trend data on this is not subtle. Global manager engagement fell from 30% to 27% across 2024, then dropped again from 27% to 22% across 2025, the largest year-over-year decline in the series.
Source: Gallup, State of the Global Workplace 2026
Middle managers carry the compression of every change programme the organisation runs, and they carry it simultaneously. Three protections make a measurable difference.
- Cap the number of concurrent change initiatives any one manager is expected to land. Count them first; the number is usually higher than leadership believes.
- Measure manager load explicitly in the load audit, as its own line rather than folded into their team’s numbers.
- Give managers a peer forum, not only a top-down training programme. Peer forums surface the problems training cannot name.
I have run the third one under real pressure. During the high-volume campaign, the daily stand-up did far more than coordinate work: it functioned as a pressure valve where the team could say what was breaking while there was still time to change it. Interviewer load came down through batch scheduling and structured assessment at the same time, which meant the peer forum and the load reduction were reinforcing each other rather than competing.
◆ PRO TIP
The honest downside: you cannot do this section properly without reducing what you ask managers to deliver, and most organisations will not. If that is your situation, say so internally rather than launching a manager well-being initiative on top of an unchanged workload. Adding a programme to a saturated population is how change fatigue becomes the outcome you accidentally engineered.
You now have a diagnosis, a design standard, and a delivery layer. What turns those into a programme is governance, and getting that wrong is the structural reason most well-being work stalls.
Employee Well-being in the Workplace: Building the Programme Architecture
Most well-being programmes fail before a single intervention is chosen. They fail at the point where accountability is assigned, because HR is handed responsibility for outcomes it does not control the inputs to.
Fix the ownership split before you spend anything.
How to execute:
- HR owns the diagnosis, the standard, and the measurement. That is a real mandate and it is deliverable.
- Line leadership owns the conditions: workload, autonomy, and manager quality. These are the variables that move the outcome.
- The executive owns the trade-off decision when conditions conflict with delivery targets. Somebody has to arbitrate, and it cannot be HR.
When leadership tries to hand the whole thing to HR, there is one reframe that works in a governance forum. Accept the measurement mandate explicitly, decline the conditions mandate explicitly, and put both in writing with the reason attached.
That reads as obstructive only if you do it verbally. In a paper it reads as clarity, and it is the same HRBP business partnering discipline that separates a credible partner from a service desk.
Then set the operating rhythm: a quarterly review where the four listening inputs are presented by team, with a named decision owner against each intervention. I reuse the same governance pattern for anything cross-functional, and it comes directly from running high-volume hiring: weekly calls with the accountable managers, SLA-based tracking, live dashboards, and one accountable owner per workstream.
The old way
- HR owns well-being
- Form a wellbeing committee with no decision rights
- Report activity to leadership twice a year
The Lab Way
- HR owns the evidence and the standard; the business owns the conditions
- Document the split before the first pound is spent
- Review by team quarterly, with a named decision owner each time
The three-tier programme stack

Order these by leverage, not by ease of purchase. That single decision determines whether the budget produces movement or produces a launch announcement.
1
Tier 1: Design
Job design, workload architecture, manager capability, and leave norms. Highest impact, lowest cash cost, hardest politically, which is exactly why it gets sequenced last in most organisations. Fund it first.
2
Tier 2: Enablement
Flexibility, career and internal mobility infrastructure, financial predictability, and structured connection. Moderate cost, moderate difficulty, and the tier where a flexible working policy either earns its keep or becomes a document nobody uses.
3
Tier 3: Support
Assistance programmes, counselling, mental health cover, apps. Lowest impact per pound and completely non-negotiable, because people in crisis need a route that works. Tier 3 is a floor, not a strategy, and its correct measure is speed of access rather than participation volume.
Most organisations build tier 3 first because it can be bought, then wonder why tier 1 problems persist. The stack is inverted against typical spend almost everywhere I have looked.
◆ FROM THE LAB
Real implementation: the clearest Tier 2 investment I have run started as a cost problem, not a well-being one. External hiring was expensive, ramp times were long, and internal candidates were finding out about roles at the same time as the external market, which meant they were competing for their own next job as strangers.
We introduced a First Look policy: a 48-hour internal posting window before anything went external, with recruiters proactively approaching internal candidates during it rather than waiting for applications. The proactive part mattered more than the window. A posting is passive; a recruiter saying “this looks like your next role” is not.
Internal hires reached 23% of all hires. Time-to-Productivity for those hires was 28 days against 67 days externally, which is 40 to 50% faster into full contribution.
The well-being result was the one nobody forecast. People could see a next move without leaving, which changed the conversation in stay interviews from “what else is out there” to “what would I need to be ready”. The operational payback funded the whole thing, and the career well-being outcome came free with it.
◆ PRO TIP
Pro tip: measure Tier 3 by time-to-first-appointment, not by utilisation percentage. Make it a contract term with your provider and review it quarterly. A service with 4% utilisation and a two-day route to a real appointment is doing its job. A service with 12% utilisation and an eleven-day wait is not.
Why nobody uses what you bought
Support services across the industry run at low single-digit utilisation while stress indicators rise. I am deliberately not quoting a percentage here, because every widely circulated figure I have traced originates with a vendor selling an alternative, and a stat without a real source is worse than no stat.
The pattern is real regardless. Four causes explain almost all of it, and each has a fix.
- Awareness. Most employees cannot name the service or its access route. Fix it with manager-delivered signposting at the moment of need, not an annual all-staff email.
- Friction. Phone-first access models and multi-day response times. Fix it by measuring time-to-first-appointment and writing it into the contract.
- Confidentiality doubt. Employees believe usage is visible to the employer. Fix it by publishing the data boundary explicitly, and then publishing it again, because one announcement does not overturn a default assumption.
- Irrelevance. The service does not address the actual problem, which is frequently load. No amount of access fixes a mismatch of purpose.
Apply the same discipline to the provider that I apply to any tool in HR vendor evaluation: a stated verdict, the conditions under which you would recommend it, and the conditions under which you would avoid it. If a provider cannot be described that way, you have not evaluated them. You have been presented to.
⚠ WATCH OUT
Watch out: utilisation is a diagnostic, not a KPI. Rising utilisation can mean the service is finally working or that conditions have worsened, and the number alone cannot tell you which. Read it alongside the load audit or do not report it at all.
Hybrid, remote and frontline: One programme will not fit three populations
The dominant risk differs by working pattern, which means one programme communicated by email is three programmes badly delivered.
Office-based populations are carrying meeting density and commute load. Remote populations are carrying isolation and boundary erosion, and the levers there are structured connection and explicit availability windows.
Hybrid is the one people misdiagnose. The dominant risk is ambiguity rather than either extreme, because unclear expectations about presence generate more strain than a clear policy in either direction. The fix is written team-level agreements, not a corporate policy that tries to cover every function at once.
Then there is the population almost every article on this topic forgets.
◆ FROM THE LAB
My experience: I spent eight years in engineering and manufacturing Talent Acquisition, and the frontline and shift population is where I have watched well-being programmes fail most completely. The dominant risks there are shift predictability, rest between shifts, physical safety, and whether services can be reached during working hours.
A digital-first well-being platform reaches almost none of them. Somebody on a rotating shift with no company laptop and a phone locked in a locker is not going to book a counselling appointment through a portal, and reporting their non-participation as low engagement is a misreading of your own data.
Design the frontline model first, because it is the hardest, and the office model will fall out of it almost automatically. Shift pattern and rest requirements vary by jurisdiction, so anything you design around shift pattern design and working time needs a legal check before it becomes a standard, particularly across multiple countries. This is also where manufacturing and engineering hiring pressure and well-being intersect most directly.
⚠ WATCH OUT
Common mistake: reporting a participation gap when what you have is a coverage gap. If any part of the workforce cannot access the service during their shift, the programme does not have an engagement problem. It has a design problem, and no communications campaign will close it.
An architecture without measurement is a set of intentions. And the measurement problem in well-being is genuinely harder than the one you are used to in Talent Acquisition.
How to Measure Employee Well-being (metrics that survive a CFO conversation)
Most well-being dashboards report what already happened. Engagement score, absence rate, attrition. All three are real, all three are lagging, and none of them tells you where to act this month.
Here’s the difference:
Leading signals, monthly, by team
- Workload sustainability score
- Leave utilisation
- After-hours activity
- Internal mobility application rate
- Manager one-to-one completion
- Time-to-first-appointment for support services
Lagging measures, quarterly, organisation level
- Regretted attrition
- Absence rate
- Engagement score
- Quality of Hire at 12 months
- Long-term sickness
Keep the two sets physically separate on the page. The discipline that matters is never presenting a lagging measure as evidence that a leading intervention worked without stating the lag out loud, because the moment a finance audience catches that, everything else you present gets discounted.
◆ FROM THE LAB
The Sofia test: in Talent Acquisition I can do clean before-and-after attribution, because the interventions are discrete and the outcome is countable. Adding competitor analysis to the process improved Quality of Hire by 12%. Talent landscape work across comparable industries added 14%. Building a skills-based pipeline off the back of market analysis moved it 30%.
I track Turnaround Time as a system output rather than a recruiter score for the same reason, and I measure Quality of Hire at 12 months rather than at 90 days because the earlier number flatters everyone.
Well-being measurement is harder than that, and I would rather say so than pretend otherwise. Too many variables move at once, and the honest position is that you are tracking direction and variance, not proving causation.
◆ PRO TIP
Real talk: well-being measurement cannot deliver clean causal attribution, and claiming that it can is how HR loses credibility with a finance audience permanently. Avoid a single composite well-being index for the same reason, since composites hide exactly the variance that makes the data useful. Report the spread, not the score.
The one-page board view
You get ten minutes at a leadership meeting, twice a year if you are fortunate. Most people spend it on a survey summary that generates sympathy and no decisions. Four blocks, one page, and the fourth block is the one that changes the meeting.
- The three teams with the highest combined load signal this month, and what is being done about each.
- The leading signal trend across six months, so the direction is visible without narration.
- The four-line cost model, refreshed with current attrition.
- One decision the board needs to make, named explicitly.
A well-being update with no decision request is a status report. Status reports do not get funded, and the habit of presenting people data to the board without asking for anything is how a function trains its executive to treat it as informational.
The working precedent for this is not an HR dashboard at all. It is the live tracker and weekly war room I ran during high-volume hiring, where the view existed to drive a decision each week rather than to record history, and that is the standard HR dashboard design should be held to.
Building this now is preparation rather than optics, and the reason is visible in the executive data.
85% / 72%
85% of executives say they will become more responsible for workforce well-being over the next one to two years, and 85% believe organisations should be required to report workforce well-being metrics publicly. 72% believe executive bonuses should be tied to those metrics.
Translation: executive accountability for workforce well-being is moving from voluntary to expected, including public reporting and remuneration linkage. The organisations with a working measurement system will meet that comfortably. The ones still presenting an annual engagement score will be assembling it under pressure.
There is one load source that sits outside every well-being model I have described, and it is owned by a completely different function.
Employee Well-being Under Load: Hiring cycles, Vacancy drag and Ramp periods
An open role is not a neutral state. The work does not pause while the requisition sits in the market. It gets redistributed to the people who remain, almost always without any adjustment to their own objectives.
Why this matters:
This is the load source no well-being model accounts for, because it is owned by Talent Acquisition and measured as a recruiting efficiency metric. The team absorbing it is not in that conversation at all.
$30,000
The lost productivity in a 60-day senior engineering vacancy, at an operational drain of roughly $500 a day. That figure counts only the missing output. It does not count the compounding load on the four people covering the gap.
You can see vacancy drag in data you already pull. A team whose after-hours activity rose in the same month a resignation landed is carrying it, and left alone it will produce the next resignation.
So treat time-to-fill on critical roles as a well-being metric. Put it on the load audit next to leave utilisation, and prioritise the requisitions where the drag on the remaining team is highest rather than the ones where the hiring manager is loudest.
The old way
- Measure time-to-fill as recruiting efficiency
- Prioritise by stakeholder volume
- Backfill every role automatically
The Lab Way
- Measure it as a load metric for the team waiting
- Prioritise by drag on the remaining team
- Ask whether the work should be removed instead of refilled
That third point is the uncomfortable one. Some roles should not be backfilled, and the honest version of workforce planning asks whether the work itself still needs doing before it asks who should do it. Refilling a role nobody can define is how load gets institutionalised.
◆ FROM THE LAB
Real implementation: an automation engineering team needed to scale, and the roles were the kind where a job advert produces four applications and none of them fit. Under the old model we would have posted, waited, and watched the existing engineers absorb the gap for a quarter.
Instead we mapped the market before we needed it. Twelve competitors across the industrial IoT space were analysed for how their engineering teams were structured, where the capability sat, and who was likely to move. By the time the job description was written, we had 37 qualified candidates already identified.
Time-to-Offer fell from 68 days to 34. That is the number a TA function reports, and it is the least interesting result in the story.
The real beneficiaries were the engineers already on the team, who spent 34 fewer days absorbing an absent colleague’s workload. That is the case for talent mapping that never gets made in a well-being conversation, and it is why I run recruitment as a Talent Supply Chain rather than a hiring plan: predictive mapping and pre-warmed communities so that demand meets a pipeline instead of a posting. Time-to-Offer is a well-being metric wearing a recruiting badge.
Protecting well-being through a ramp
Growth ramps, seasonal peaks, project launches, and restructures are not anomalies in a growing business. They are the operating pattern. Four mechanics make them survivable.
1
Forecast capacity backward from the end date
Name the shortfall before it happens rather than discovering it in week four. This is the same method behind any credible high-volume hiring plan, and it turns an unpleasant surprise into a resourcing decision somebody can make.
2
State the end date of the intensity publicly
Unbounded pressure is what breaks people, not high pressure. A team that knows the peak ends on a named date behaves completely differently from a team that suspects this is simply how things are now.
3
Book the recovery into the plan
With dates, in the plan, before the peak starts. Recovery promised afterwards is recovery that competes with whatever arrives next, and whatever arrives next always wins.
4
Protect the peak team from business as usual
People carrying the peak cannot also carry their standing workload, which requires someone senior to formally deprioritise things in writing. Without that, the peak is simply added to everything else and called commitment.
The high-volume campaign is the proof that this holds under real pressure. Capacity was mapped backward from the business start date, interviewer load was reduced by design, and the daily stand-up gave the team somewhere to put the strain. 420-plus hires landed in 10 weeks with 90-day retention at 85 to 88%, which tells me the ramp consumed neither the people it hired nor the people who ran it.
◆ PRO TIP
The catch: this only works if a senior person is willing to formally deprioritise work, and that is a leadership decision rather than an HR one. If nobody will sign that, you are not designing a ramp. You are scheduling an attrition event and hoping it lands in someone else’s quarter.
Eleven sections of argument are worth nothing without a sequence. Here is the one I would run.
The 90-day Employee Well-being Blueprint
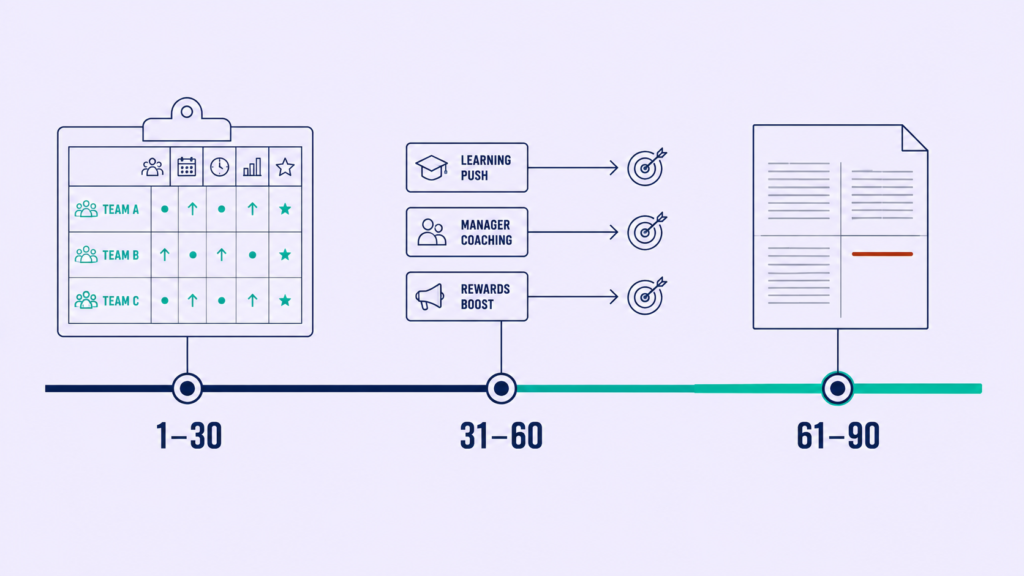
Every action below is doable by an HR leader with no new budget and no new headcount. That constraint is deliberate, because a plan that depends on funding you have not secured is a wish with phases.
Here’s how to build it:
1
Days 1 to 30: diagnose
Owner: HR. Output: a ranked three-team priority list.
- Run the load audit on data you already hold: leave utilisation, after-hours activity, overtime, vacancy duration, and span of control, all by team.
- Run the four questions as a short pulse. Report by team, never by organisation.
- Map current spend against the three-tier stack to expose where the money sits.
- Agree the ownership split in writing: HR owns evidence and standard, the business owns conditions.
2
Days 31 to 60: design
Owner: HR plus the three named team leaders. Output: three interventions in flight.
- Pick the three highest-load teams. Nothing else. The restraint is the design.
- For each team, choose one Tier 1 intervention: load, autonomy, or manager capability. Not a support-tier purchase.
- Put one well-being outcome into each of those three managers’ objectives.
- Fix the single worst access-friction point in your existing support service.
3
Days 61 to 90: prove
Owner: HR. Output: the one-page board view with a decision request attached.
- Re-run the four questions on the three teams only.
- Refresh the leading metrics and look at the direction, not the level.
- Build the four-block board page.
- Take one decision to the leadership team. One. Named.
Then hold the line on scaling. Do not extend this to the rest of the organisation until one team’s leading signals have moved, because a programme that scales before it works scales the wrong thing across a much larger population.
⚠ WATCH OUT
Common mistake: scaling before one team’s numbers have moved. Organisation-wide launches are politically satisfying and diagnostically useless, because when nothing improves you have no idea which of the eleven things you changed was the problem.
This blueprint is not new thinking. It is the operating pattern I have used on every difficult delivery I have owned, applied to a different domain: diagnose with data you already hold, design against the real constraint, prove with a leading signal, then scale. The high-volume campaign ran on exactly this structure, mapped backward from the deadline, governed weekly, and measured daily, and there is a reason I keep returning to it. It works when the pressure is real, which is the only condition worth designing for.
If you want the next blueprint before it goes out publicly, the Lab newsletter is where these frameworks land first. It is one email, and it exists to give you the plan before you need it rather than after.
Frequently Asked Questions
What is employee well-being?
Employee well-being is the combined physical, mental, financial, social, and career health of a workforce, shaped mainly by working conditions rather than by benefits. It is an outcome of how work is designed, not a category of provision. Workload, autonomy, and manager quality move it further than any benefit in your catalogue.
What are the 5 pillars of employee well-being?
Career, social, financial, physical, and community well-being. Career covers role clarity and progression, social covers connection and mattering, financial covers stability and predictability, physical covers energy and recovery, and community covers contribution beyond the job. Career well-being is the strongest predictor of overall life evaluation and the domain employers control most directly, so it is where to invest first.
Why is employee well-being important?
Because it determines attrition, productivity, and a team’s capacity to absorb change. Poor well-being appears as cost long before it appears in a survey, across four lines: attrition, presenteeism, absence, and the opportunity cost of work nobody had capacity to propose. Presenteeism is the largest of the four and the one almost nobody measures.
How do you measure employee well-being?
Split it into leading signals reported monthly by team and lagging measures reported quarterly at organisation level. Leading signals include workload sustainability, leave utilisation, after-hours activity, and internal mobility applications. Lagging measures include regretted attrition, absence, and engagement. Organisation-level averages hide the teams that need help, so segment or do not bother.
What is the difference between employee well-being and employee engagement?
Engagement measures how invested someone is in the work. Well-being measures what the work is doing to them. They move together often enough to be confused on a dashboard. High engagement alongside declining well-being is the pattern that precedes losing your best performers, because the people who care most absorb the most.
Where This Leaves You
The organisations whose people are thriving are not the ones with the largest well-being budgets. They are the ones whose work is designed to be survivable and whose managers still have the capacity to notice when it is not.
That is what the operating system metaphor means in practice. Diagnose before you prescribe. Design before you buy, and prove it on three teams before you scale it to three thousand people.
What separates the organisations that will execute this from the ones that will not has nothing to do with budget. It is the willingness to have the conditions conversation instead of the provision conversation, and to walk into the leadership meeting with one decision request instead of one more status update.
The Deloitte finding earlier in this guide is the deadline nobody has told you about. Executive accountability for workforce well-being is moving from voluntary to expected, and the functions with a working measurement system will meet that transition without breaking stride.
So pick three teams. Not eleven interventions. One Tier 1 change per team, run over the next 90 days, measured on a leading signal you chose before you started.
Then take the result to your board and ask them for a decision. If you are working through this in your own organisation, particularly the conditions conversation, connect with me on LinkedIn and tell me what happened when you asked.
