
I have spent 8+ years in Talent Acquisition, and at my busiest I was personally running 250+ hires a year.
So I know exactly what this looks like from the inside. You ran the survey. You built the action plan from last cycle, you chased the completion rate, and you presented a deck that nobody argued with.
The score went down anyway. Now you are sitting in a room being asked to explain a decline you did not cause, using data that cannot tell you where it came from.
Most organisations think they have an engagement problem. What they have is a manager capacity problem wearing an engagement costume.
Here is what that costs, in the only currency your CFO reads. When a senior technical role sits open because the person in it disengaged and left, my working benchmark is a $500 a day operational drain.
$30,000
Lost productivity from a single 60-day vacancy on a senior technical role, at a $500 a day operational drain. One person. One gap. One quarter.
Multiply that across every critical role you lost last year and you have your real engagement budget, already spent, just spent badly. Globally the same problem costs around $10 trillion in lost productivity, roughly 9% of global GDP.
That global figure is useless in a budget meeting. Yours is not.
Here's what this guide contains:
- An operational definition of employee engagement that survives a CFO conversation, with a two-part test you can run on any team
- A four-step model to calculate the cost of disengagement on your own headcount, with a worked example on a 500-person organisation
- A four-way ownership split you can get signed before the next survey launches, so the argument about who owns engagement happens before the results, not after
- A six-step operating model with a named owner, a cadence, and a completion test at every step
- The five failure patterns that kill engagement programmes, with the tell for each one
HR Insights Lab approach: every driver in this guide is separated into inputs you can change and outputs you cannot. Every recommendation carries an owner and a completion test. Where the evidence is thin, I say so rather than filling the gap with a percentage.
What is Employee Engagement?
Employee engagement is the measurable degree to which an employee applies discretionary effort to work outcomes and intends to remain with the organisation. It works through two observable behaviours: doing work nobody asked for, and turning down comparable offers elsewhere. It matters because it is the earliest people signal that predicts financial and operational performance, months before those numbers move.
Here's the deal:
Almost every definition you can find describes engagement as an emotional state. "Emotional commitment to the organisation" is the standard phrasing, and it is unusable.
You cannot budget against an emotion. You cannot staff against it, set a target against it, or report it to a board that will ask what changed and why.
Employee Engagement, Defined
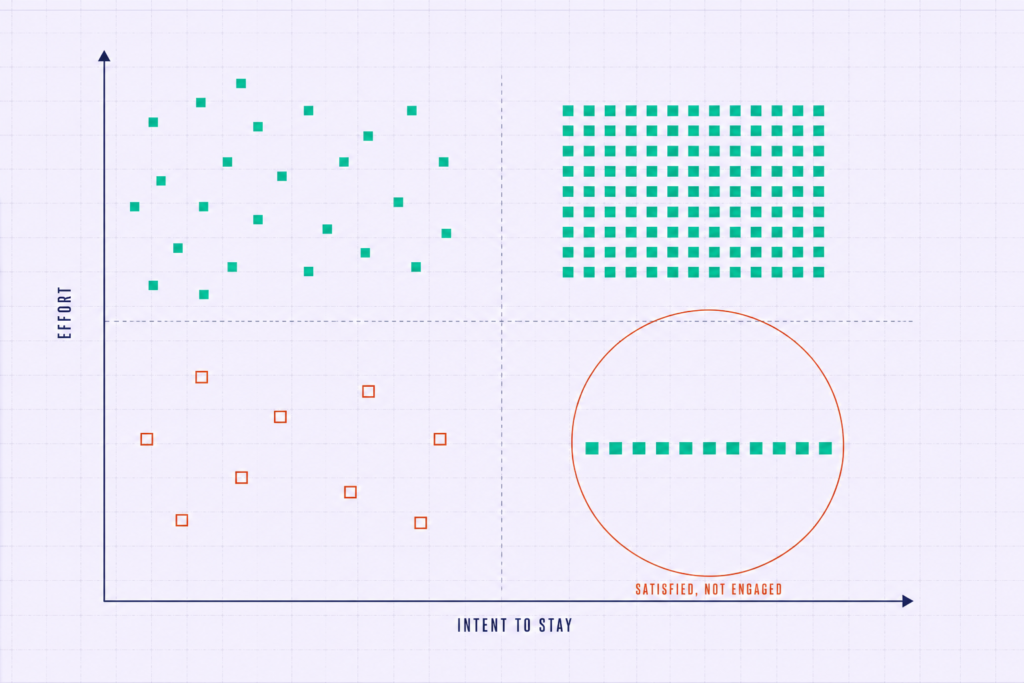
Define it as a condition instead of a feeling, and it becomes manageable. Engagement is discretionary effort plus retention intent, and both halves are visible without a survey.
The two-part test: does this person do things nobody asked them to do that make the work better, and would they take a comparable offer elsewhere tomorrow?
Run that test on any team and you get an answer in ten minutes. Run a 60-item survey and you get a number in six weeks that nobody knows how to act on.
The old way
- Define engagement as how employees feel about the company
- Measure the feeling once a year
- Report a composite score with no behavioural anchor
- Defend the budget on sentiment
The Lab Way
- Define engagement as discretionary effort plus retention intent
- Give managers behavioural tells they can read weekly
- Report the condition at team level with the behaviour attached
- Defend the budget on retained capability and avoided vacancy cost
The industry has resisted this for a long time. The 2009 MacLeod Review found over 50 competing definitions of engagement, and the CIPD still flags the question as unresolved.
Fifty definitions is not academic richness. It is what happens when a discipline never agrees on what it is measuring, and it is why engagement budgets are the first thing cut when the year gets hard.
We apply the same discipline to hiring quality. A definition you cannot measure is a definition you cannot fund, which is exactly the argument behind how we define Quality of Hire as a behavioural outcome rather than a hiring manager's satisfaction rating.
Engagement vs Satisfaction vs Happiness vs Experience
These four terms get used interchangeably in most HR conversations. They are not the same thing, and confusing them is expensive.
| Term | What it measures | What it is | Who controls it |
|---|---|---|---|
| Satisfaction | How employees feel about their conditions: pay, flexibility, tools, the team | A lagging comfort measure | Largely the employer |
| Happiness | Mood state on any given day | A personal condition | Largely outside the employer's control |
| Employee experience | The sum of every touchpoint from application to exit | The input | The employer, by design |
| Engagement | Discretionary effort applied and intent to stay | The output condition | Shared, and only partly HR's |
The operational consequence sits in one sentence. A satisfied employee can be completely disengaged, and that combination is the most expensive workforce you can run.
◆ PRO TIP
Real talk: here is the tell. You invest in perks, the satisfaction score jumps six points at the next pulse, and the engagement number does not move at all. That gap is the entire problem in one chart. They like the pay, the flexibility, and the team, and they contribute nothing beyond the minimum scope. Gallup has held this position for years, that the right culture is not built on employee satisfaction, and the practitioner version is blunter: comfort does not produce effort.
Experience is the input you design, and it deserves real investment. That is the argument for treating employee experience design as an operating discipline rather than a set of moments, but designing the input does not entitle you to the output.
I hold an unpopular view on this, and the retention data behind it has never moved me off it. Higher salaries do not solve retention, because retention problems are mostly systems failures rather than compensation failures, and the same logic applies here: comfort investments do not produce engagement.
The Three States: Engaged, not engaged, and actively disengaged
Gallup's taxonomy splits any workforce into three states. Most articles reproduce the three-bucket graphic and move on, which teaches a manager nothing.
The useful part is the behavioural tell for each state, because a manager can read a tell without waiting for a survey cycle.
- Engaged. Psychologically committed, drives performance and improvement. The tell: they raise problems before those problems escalate, including problems that make their own work look harder.
- Not engaged. Present, compliant, checked out. Roughly six in ten people globally sit here. The tell: they complete exactly the scope they were given and never the adjacent work that would obviously help.
- Actively disengaged. Unhappy and acting on it. The tell: they recruit others to their frustration, which is why this group exports the condition rather than containing it.
Here's the difference:
Some models use four levels instead of three, splitting the engaged group into highly engaged and moderately engaged. That fourth level is a threshold choice, not a distinct psychological state.
Pick whichever model your instrument supports and stop debating it. What matters is that every manager can name which state each of their people is in this week, which is a conversation for manager one-to-one frameworks rather than a taxonomy argument.
Why is Employee Engagement Important? The 2026 Business Case
Employee engagement is important because it is a leading indicator of financial and operational performance, not a soft measure of morale. Engaged business units produce higher profit, fewer defects, fewer absences, and lower turnover than disengaged ones. The practical value sits in the timing: engagement moves before the P&L does, which makes it the earliest warning you get.
You do not need convincing that engagement matters. You need a number to put in front of a CFO, and that is where every competing article stops.
What engagement predicts
Build the mechanism before you reach for the number, because Finance will ask how, not what.
Engaged teams surface problems earlier, so defects, absences, and safety incidents fall before anyone runs a campaign about them. They stay, so institutional knowledge compounds instead of walking out every 18 months. They serve customers better because they are paying attention, so revenue per head rises without a headcount change.
That is the causal chain. The meta-analysis is the proof.
23%
Higher profitability in top-quartile engagement business units compared with bottom-quartile units, alongside 18% higher productivity in sales and 43% lower turnover in low-turnover organisations.
| Outcome | Top vs bottom quartile | What it means on the ground |
|---|---|---|
| Profitability | 23% higher | The same revenue converts better because rework and escalation fall |
| Productivity (sales) | 18% higher | Your existing headcount delivers a quarter you were planning to hire for |
| Customer loyalty | 10% higher | Retention of accounts, not just retention of people |
| Absenteeism | 81% lower | On a 500-person plant, a shift-coverage model that stops needing overtime |
| Safety incidents | 64% fewer | Operators report near-misses instead of absorbing them quietly |
| Turnover | 43% lower | Fewer requisitions, shorter Time-to-Fill, lower agency spend |
Source: Gallup, "The Benefits of Employee Engagement"
Never leave a percentage sitting naked in a leadership deck. Translation on the absenteeism figure: 81% lower absence on a 500-person plant is not a statistic, it is a shift-coverage model that stops needing overtime to hold the line.
◆ FROM THE LAB
My experience: the retention half of this chain is the half most leaders assume they have to trade away for speed. Earlier in my career I ran a bulk hiring campaign that delivered 420+ hires in 10 weeks, and the number I was most nervous about was not volume. It was 90-day retention.
It came in at 85 to 88%, in line with the historical benchmark for those roles, at more than double the usual hiring rate. Speed did not cost us retention because the system was designed to carry both. Retention and velocity are not a trade-off. They are a design question.
Present this chain the way Finance presents theirs, with the mechanism first and the number as evidence. That is the same discipline behind the TA metrics CFOs care about, and it is why those conversations go differently.
How to calculate the cost of disengagement in your own organisation
Here is the laziest move in the entire top 10 of this search result. Quote the global cost of disengagement, then stop.
$10 trillion
Global cost of low engagement in lost productivity, around 9% of global GDP. Global engagement fell to 20% in 2025, down from 21% in 2024, the lowest level since 2020.
Source: Gallup, "Global Employee Engagement Continues Decline", 7 April 2026
Nobody has ever approved a budget on the strength of a GDP percentage. You need your number, and you can build it in four steps.
Here's how to build it:
1
Take your disengaged percentage
Add your not-engaged and actively-disengaged percentages from your last survey. Use the real figure, including the caveats. If your response rate was 54%, note that, because it becomes relevant in the measurement section.
2
Multiply by headcount
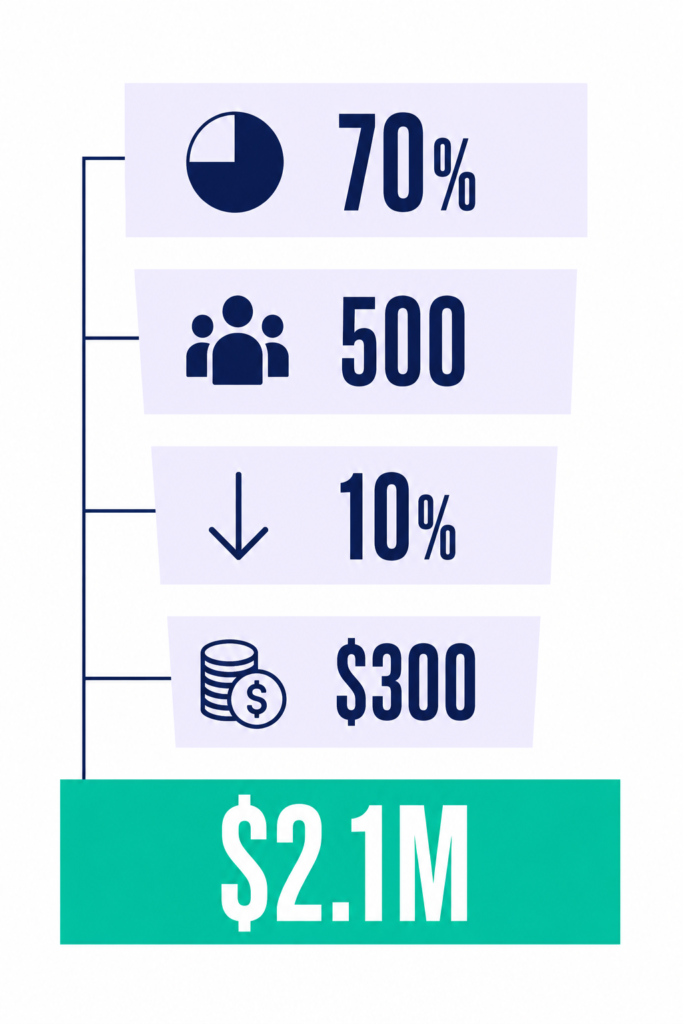
That gives you the affected population as a number of people rather than a percentage. On a 500-person organisation with 70% not engaged or actively disengaged, that is 350 people.
3
Apply a conservative effort delta
Gallup's productivity differential is 18% on sales. Use 10 to 15% as your floor, because a defensible low number survives cross-examination and an aggressive one does not. Pick the bottom of the range and say why.
4
Multiply by fully-loaded cost per employee
Salary plus benefits plus overhead, taken from Finance rather than estimated. On 350 affected people at a $60,000 fully-loaded cost and a 10% effort delta, the annual figure is $2.1 million. That is the number your CFO will engage with.
Then add the vacancy drain on top, because disengagement is what creates the vacancy in the first place. At $500 a day, a 60-day gap on one senior technical role is $30,000, and critical roles rarely close in 60 days when your pipeline is reactive.
◆ FROM THE LAB
The Sofia lens: I have watched this curve from both ends. Before a direct sourcing initiative I led, cost per hire on senior engineering roles ran at ₹6.5 to 7.5 lakhs with a Time-to-Fill of 70 to 80 days. After it, cost per hire came down to ₹3 to 3.8 lakhs and Time-to-Fill to 45 to 50 days, a reduction of roughly 45 to 55%.
Here is the part that connects to engagement. Every senior person who leaves because the system failed them puts you straight back at the top of that curve, paying agency rates and 80-day cycles again. Disengagement does not just cost productivity. It resets your entire hiring economics.
Take that four-step model into the room with a conservative assumption at every step and you have changed the conversation. That structure is the same one behind building the business case for HR investment on any people programme, not only this one.
What engagement does not fix
This is the part vendor content will never write, and it is the reason you can trust the rest of this guide.
Engagement does not fix a broken business model. It does not fix a product nobody wants, a compensation structure genuinely below market, or a role that has been badly designed from the start.
High engagement on a doomed product line produces committed people executing a losing strategy faster. That is worse than apathy, because it burns your best people on the wrong thing.
◆ PRO TIP
The honest downside: here is the diagnostic question to ask before you accept the programme. If you fixed engagement entirely and the business outcome would still fail, engagement is not your constraint, and taking the mandate anyway means owning someone else's strategy problem.
The CIPD has been honest that broad composite engagement scores oversimplify what is happening in an organisation. Quantum Workplace, a vendor with every commercial reason to say otherwise, acknowledges that engagement alone cannot solve all organisational issues. Believe both of them.
My systems position cuts both ways here, and an honest take has to name both directions. Retention problems are mostly systems failures rather than compensation failures, but if your pay is genuinely below market, no engagement intervention will hold, which is why compensation benchmarking belongs in the diagnosis before the programme, not after it fails.
The Benefits of Employee Engagement for the Business, The Manager, and The Employee
Every article on this topic writes the benefits from one side: the employer's. The manager who has to change their behaviour and the employee who has to believe the programme are both missing.
You cannot sell an engagement programme to three audiences with one ledger.
Business benefits
Here's the difference:
A bulleted benefit with a percentage attached tells an executive committee nothing they can act on. A benefit with its mechanism attached survives the follow-up question, which is always some version of "how".
- Profitability. Rework and escalation fall, so the same revenue converts at a better margin. Cross-reference the Q12 outcome set above for the quartile comparison.
- Productivity. Discretionary effort is unpaid capacity. You are already funding the headcount; engagement determines how much of it you receive.
- Retention of critical skills. The people you lose first in a disengaged organisation are the ones with the most external options, which is the inverse of the retention profile you want.
- Customer outcomes. Engaged people notice the account is drifting before the renewal conversation, because noticing is discretionary.
- Safety performance. Engaged operators report near-misses instead of absorbing them, so you get the leading indicator rather than the incident.
- Speed of change adoption. Engaged teams do not need a second persuasion cycle, which shortens every transformation timeline you have on the plan.
- Cheaper hiring. Engaged employees refer, and referred candidates convert at multiples of the general applicant pool. Nobody in the top 10 names this one.
◆ FROM THE LAB
The Sofia test: in one of the organisations I worked with, a single senior engineer referred 11 people over two years. Nine were hired. Eight are still there.
His referral conversion rate was 82% against a company average of 31%, and the agency fees we avoided came to roughly ₹40 lakhs. No referral campaign produced him. Engagement did.
A disengaged employee does not put their professional reputation behind an introduction. That is why a falling referral rate is a cheaper engagement instrument than most survey platforms, a point I take further in employee referral programmes that work.
Manager and team benefits
This is the section missing from the entire top 10, and its absence explains why so many engagement rollouts die quietly in the second quarter.
Managers abandon engagement work because it arrives as an additional responsibility on a person who has no capacity left. Sell it as capacity returned and the conversation changes.
The old way
- Brief managers on the engagement action plan
- Add engagement to their objectives
- Chase completion at the quarterly review
- Conclude that managers lack commitment
The Lab Way
- Audit span of control and delivery load first
- Sell engagement as escalations and rework removed
- Give one change to make, not a nine-item plan
- Fix the structure when the behaviour does not hold
Name what the manager personally gets, in their language. Fewer escalations landing on their desk at 6pm. Less rework because the team caught it at the source.
A team that self-corrects without them in the room. A shorter path to backfill, because their people refer into their own team. And the one that matters most to anyone running a delivery load: the ability to take leave without the team stalling.
⚠ WATCH OUT
Common mistake: selling the benefit harder to a manager who has no capacity to act on it. A manager carrying 12 direct reports and a full delivery load cannot run engagement, no matter how well you make the case.
Audit span of control before you build the enablement programme. Persuasion is not a substitute for hours, which is the whole argument behind span of control and manager capacity as a design constraint rather than an org chart detail.
I have seen the structural version of this work and the motivational version fail. In the bulk campaign I mentioned earlier, recruiter productivity rose by around 35%, and not one point of that came from asking people to try harder. It came from batch interviewing and structured scorecards, which is to say it came from changing the system rather than the willingness.
Employee benefits
Your workforce has seen three of these programmes. They assume this one is also about extracting more output for the same money, and they are not being cynical. They are pattern-matching.
- Lower burnout risk. Engagement built on role clarity and realistic load is protective. Engagement built on pressure is not engagement, it is compliance with a deadline.
- Faster skill acquisition. Engaged people seek stretch work, and stretch work compounds capability faster than any training calendar.
- Stronger internal mobility odds. The person who contributes beyond scope is the person a hiring manager in another function has already noticed.
- Better psychological safety. Raising a problem early only works in a team where raising it early is survivable.
- Clearer career visibility. A functioning internal market is the difference between a job and a career path, and employees can tell which one they have.
Under a First Look policy I ran, 23% of hires were internal moves, and those internal hires reached productivity in 28 days against 67 days for external ones. The career-visibility benefit is not a slogan in that data, it is a 39-day difference in how fast someone becomes effective in a new role.
Engagement is what makes an employee look internally first. That is the practical case for treating internal mobility as a career path rather than an HR process, and I come back to it in detail later in this guide.
◆ PRO TIP
Real talk: an organisation that communicates employee benefits while measuring only employer outcomes gets read as insincere within one survey cycle. People check whether the scoreboard matches the speech.
Publish both sides of the ledger in the same document. What the business gets, and what the employee gets, on one page, with the same level of specificity on each side.
The Engagement Collapse: What Changed Between 2024 and 2026
Every article ranking for this topic is written as though engagement is a stable discipline with a stable problem. It is not.
Something specific broke between 2024 and 2026, it did not break evenly across the population, and knowing where it broke changes what you do about it.
Here's what changed everything:
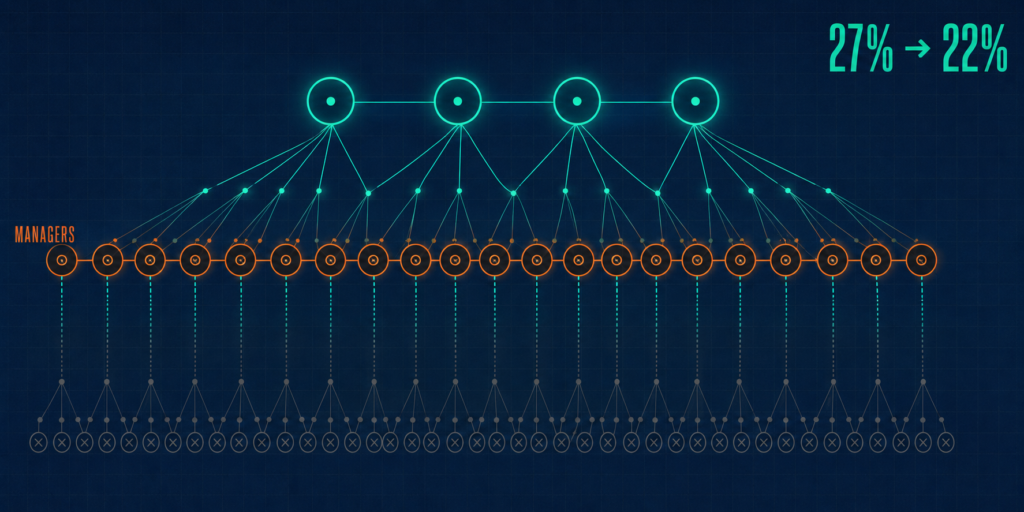
The manager layer broke first

Engagement has always been transmitted through managers. Not communicated through them, transmitted through them, the way a signal moves through a cable.
So a collapse at the manager level is not one more data point in the trend. It is the transmission mechanism failing, which means every intervention aimed at employees has to pass through a layer that has stopped conducting.
27% → 22%
Manager engagement fell five points in a single year, from 27% in 2024 to 22% in 2025, while individual contributor engagement held roughly steady at 18% to 19%. South Asia saw the steepest regional decline, with manager engagement falling eight points. Gallup estimates managers account for at least 70% of the variance in engagement scores across business units.
Sources: Gallup, "Global Employee Engagement Continues Decline" (2026) and Gallup, "Why Great Managers Are So Rare" (updated 2026)
The 70% figure is what makes the five-point drop consequential rather than merely interesting. A five-point fall in the layer that drives most of the variance is not a proportional problem. It is a multiplied one.
Watch how it propagates. A disengaged manager does not run the one-to-one, does not close the loop on the survey, and does not fight for their team's development budget in the planning meeting.
Their team reads all three of those omissions as an accurate signal about their own value to the organisation. They are not wrong to read it that way.
This is a manager capacity failure, not an employee attitude failure. Treat it as the second and you will spend a year communicating at a problem that needed restructuring.
The regional detail matters if you run teams in India, and I have not seen a single competing article surface it. An eight-point manager decline in South Asia means the population most likely to be running your delivery teams is the population that fell hardest.
My operating view has not changed in eight years of watching this. Retention problems are systems failures rather than compensation failures, and poor manager capability sits near the top of that list of systemic causes, which is why manager effectiveness frameworks belong in the diagnosis rather than the follow-up.
AI insecurity is now an engagement variable
Job security anxiety used to sit in the background of engagement data. It has moved into the foreground, and no mainstream engagement model includes it as a driver.
The anxiety is rational, and the evidence gap is the reason why. Organisations are restructuring in AI's name considerably faster than AI is delivering the productivity that would justify it, and employees can feel the mismatch even when they cannot cite the research.
1%
Share of layoffs in the first half of 2025 that resulted from AI increasing employee productivity. Separately, 42% of workers report their organisations do not evaluate AI's impact on people, and while 60% of executives use AI in decision-making, only 5% say they manage that use well.
Sources: Gartner, Top Future of Work Trends for CHROs in 2026 and Deloitte, 2026 Global Human Capital Trends
Your workforce is responding accurately to a real mismatch between what is being announced and what is being delivered. Treating that as a communication problem insults them.
The operational instruction is simple and almost nobody follows it. Add an AI-impact item and a job-security item to your engagement instrument, because you cannot manage a driver you do not measure.
Then pair every AI announcement with a workforce-impact statement. Announcing an AI strategy without one produces a measurable engagement drop in the following cycle, and you will spend the next two quarters attributing it to something else.
◆ FROM THE LAB
The Sofia lens: I led AI and prompt engineering work inside a recruitment function while the same anxiety was moving through my own team. The temptation was to under-communicate, on the theory that quiet change frightens people less. That is exactly backwards.
We ran it as a co-pilot model rather than a decision-making one, and we said so out loud. AI took the high-volume, low-judgment work: scheduling, CV parsing, talent rediscovery, market mapping, and compliance workflows. Human-led validation stayed at every decision point, because a recruiter owns judgment, context, and the final call.
We were equally explicit about the risks, in writing. Over-dependence on automation. Loss of the personal touch that makes a candidate say yes. Algorithmic bias, where flawed training data quietly reinforces historical hiring prejudice.
Naming the risks is what protected the trust. The reframe I used with the team is the one I still use: AI does not replace recruiters, it replaces the parts of the job that stopped recruiters being effective in the first place. Saying that explicitly, and then proving it in what we automated, was the intervention. I go deeper on this in AI in HR without the hype.
The return-to-office whiplash
I am not going to tell you whether remote or in-office is better. That argument dates instantly and it is not where the engagement damage came from.
The damage came from the reversal. Employees restructured their housing, their childcare, and in some cases their city around a policy the organisation described as permanent, then absorbed the full cost of the reversal without being consulted.
The transferable principle sits underneath every policy decision you will make this year. Engagement is a function of predictability and voice, not of any specific work arrangement.
Why this works:
For any policy reversal, publish three things: the reasoning, the data behind it, and what would have to change for the decision to be revisited. The third one is the one everybody skips and the one employees are asking for.
Organisations that did this saw materially less engagement damage than organisations that announced by memo. The process is the intervention, because the process is what people are rating when they answer the trust items on your survey.
⚠ WATCH OUT
Watch out: the memo announcement is not a communication shortcut, it is a trust withdrawal you will pay for over two survey cycles. A reversal announced without reasoning reads as a reversal that had no reasoning.
If leadership will not publish the rationale, that is your signal to negotiate the engagement target before the results land rather than after. The same sequencing logic runs through change communication for HR.
What Drives Employee Engagement, and What Only Correlates
Every competitor produces a driver list. None of them separate drivers from outcomes, and that single omission is why HR teams keep funding things that correlate with engagement without causing it.
A driver is an input you can change. An outcome looks identical in a regression and behaves completely differently when you invest in it.
Why does this matter?
Because your budget is finite and your credibility is more finite still. Spend a year on the wrong half of the list and you do not get a second mandate.
The drivers that hold up under intervention
Apply one test to every candidate driver. If you changed only this input and nothing else, would engagement move within two survey cycles?
Seven pass that test. Ranked by expected effect against effort, starting with the one that costs nothing.
- Role clarity. Knowing exactly what is expected. The strongest driver on the list and the most neglected, because it is free and therefore nobody builds a programme around it. Implementation: every person can state their top three outcomes for the quarter without checking a document.
- Manager quality and cadence. Specifically the existence of a real weekly or fortnightly one-to-one, not its presence in a calendar. Implementation: audit whether the meeting happened, not whether it was scheduled.
- Development and skill progression. Visible, funded, and time-boxed. Josh Bersin's prescription is a budgetable instruction rather than a principle: allocate 1.5 to 2% of payroll to meaningful development.
- Recognition frequency and specificity. Cadence beats budget, every time. Implementation: monthly, named, referencing the actual work.
- Autonomy within a defined scope. Autonomy without a defined scope is abandonment, and it reads as neglect on a survey.
- Voice with visible consequence. Being asked, and then seeing something change. Asking without the second half is worse than not asking.
- Internal mobility that functions. Not a policy that exists, a market that moves people. Bersin reports organisations rotating people through roles are around 27% more profitable.
Source: Josh Bersin, "Employee Engagement and Happiness Crisis. What Should We Do?" (August 2025)
Look at that list against the systemic causes of attrition and the overlap is close to total. Unclear career paths, poor manager capability, missing role clarity, burnout from bad operating models, and weak internal mobility are the same five things wearing different labels.
Role clarity is where I would start in any organisation, and it is the one nobody funds because there is nothing to buy. It is also the argument for designing role clarity into the job architecture rather than leaving it to whoever writes the requisition that week.
◆ FROM THE LAB
Real implementation: our referral programme was underperforming and the standard diagnosis was awareness. Run another campaign, raise the bonus, put it on the intranet again. I looked at the distribution instead.
A small group of people were producing almost all of the successful referrals, and the programme was treating them identically to everyone who had never referred anyone. So we stopped being democratic about it.
We identified the top 5 to 10% of referrers and gave them something a bonus cannot buy: Talent Scout status, named and visible, plus VIP perks and a standing quarterly meeting with the Talent Acquisition team where they saw the hiring roadmap before anyone else did.
One senior engineer in that group referred 11 people, nine were hired, and eight are still with the organisation. His conversion rate was 82% against a company average of 31%, and the avoided agency fees came to roughly ₹40 lakhs.
The transferable lesson is about recognition, not referrals. Recognition works when it is specific and status-based. It stops working the moment it becomes broad and generic, because a reward everybody gets is a reward that signals nothing.
The outcomes people mistake for drivers
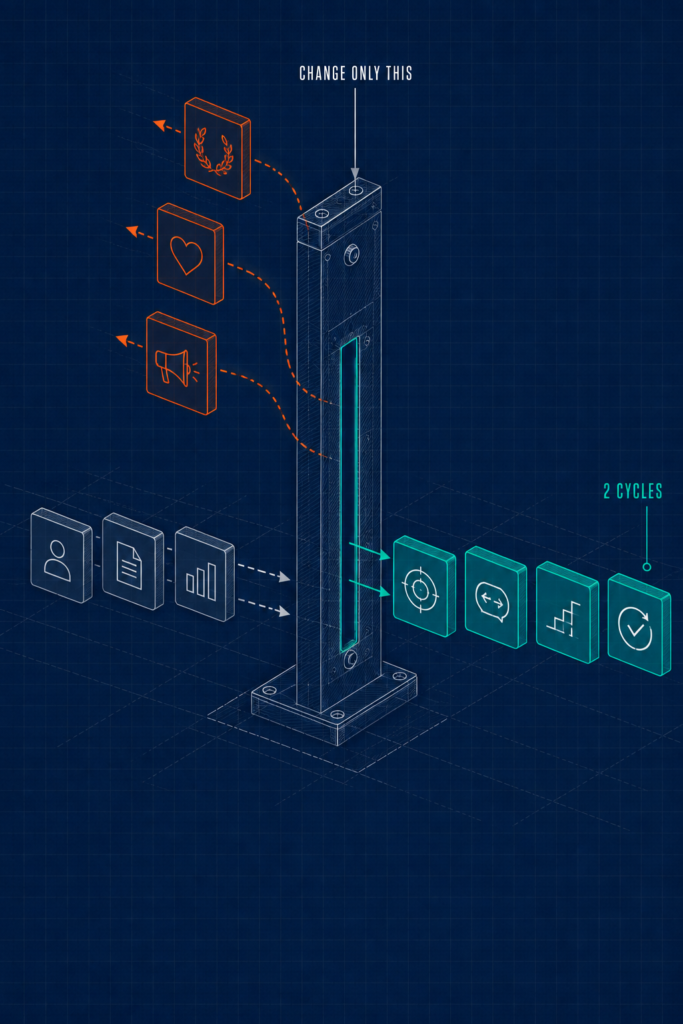
Pride in the organisation. Willingness to recommend as an employer. Reported wellbeing.
All three correlate strongly with engagement. All three are outputs, and investing in them directly produces campaigns rather than change.
| Inputs you can change | Outputs that only look like inputs |
|---|---|
| Role clarity and scope definition | Pride in the organisation |
| One-to-one cadence and manager capacity | Willingness to recommend as an employer |
| Development budget and time allocation | Reported wellbeing |
| Recognition frequency | Sense of belonging |
| Decision rights and autonomy scope | Trust in senior leadership |
| Internal posting rules and mobility mechanics | Overall satisfaction with the company |
Here is the diagnostic that sorts any list in under a minute. If the only way to improve a metric is to change how people feel about something, rather than change something about the work, it is an outcome.
⚠ WATCH OUT
Anti-pattern: accepting your survey vendor's driver ranking and building the action plan from the top three. When outputs rank at the top of that analysis, the action plan writes itself into an employer brand campaign.
Which is how a team ends up running a brand exercise to fix an engagement problem caused by span of control. Sort the list into inputs and outputs before you read the ranking, a habit I unpack in reading an engagement survey like a practitioner.
Bersin's core argument lands in the same place from a different direction. He attributes the engagement and happiness decline to structural causes rather than sentiment: abruptly reversed remote-work policies, AI capability oversold into unnecessary layoffs, and eroded social connection, with 86% of workers experiencing regular fear at work, 34% afraid to speak up, and 40% worried about job stability.
Structural causes need structural fixes. The tool produces the ranking, and the practitioner decides what is actionable, which is the same rule I apply to any AI output in a hiring process.
What does not drive engagement, and where the budget is currently going
This part is going to be unpopular. Say it anyway, because your budget is being spent here right now.
Perks, events, and office amenities do not drive engagement. They drive satisfaction, which is a different metric with a much shorter half-life. Team-building activities, wellness weeks, ping-pong tables, and "fun at work" initiatives belong in this category, and no, they do not have their place in an engagement budget.
Pay above the market threshold does not drive engagement, though pay below it destroys engagement quickly. That relationship is asymmetric, and treating it as symmetric is how compensation budgets get spent on a problem they cannot solve.
Pay below market destroys engagement. Pay above market does not create it. Budget accordingly.
Two more that will cost you nothing to stop. Engagement surveys do not drive engagement, only the action taken afterwards does. Annual recognition awards do not drive engagement, frequency does.
The old way
- Fund the engagement calendar
- Refresh the perks package annually
- Run the awards night
- Spread the spend evenly across the population
The Lab Way
- Audit current spend against the causal driver list
- Move the perks line into manager capacity
- Move the awards line into recognition cadence
- Concentrate the spend where the variance is
The concentration point is the one leaders resist and the one the data keeps confirming. In referrals, 5 to 10% of employees generate 60 to 70% of successful hires, and activating the few beats campaigning at the many.
Engagement spend follows the same asymmetry. Concentrated investment in the manager layer beats broad investment across the whole population, which is also the design principle behind recognition programmes that hold up past their first year.
Employee Engagement in HR: What HR owns, What it doesn't, and Why the difference matters
Responsibility for employee engagement splits four ways. Leadership owns the funding decision and the structural conditions, HR owns the system that measures and enables, managers own the daily execution, and employees own honest participation. Anyone who tells you engagement is everyone's responsibility has just described how accountability disappears.
Search this term and you will find glossary pages that define engagement and say nothing about ownership. That gap is not academic. It is where careers get damaged.
The four-way ownership split
Here's how to build it:
| Owner | Owns | Does not own | Frequently misassigned |
|---|---|---|---|
| Leadership | Funding, headcount, span of control, restructuring pace, honesty of communication | Daily team experience | Handed the "sponsor" label with no accountable metric |
| HR | The measurement instrument, diagnostic cadence, manager enablement, action-loop governance, the data | Span of control, restructuring decisions, manager selection in most organisations | Given the aggregate engagement score as its KPI |
| Managers | The one-to-one, recognition, the local action plan, escalation | Their own span of control or delivery load | Asked to run engagement without capacity being checked |
| Employees | Participation and honesty in the instrument | Fixing the conditions they are reporting on | Blamed for a low response rate that reflects a broken loop |
Write this split down and get it signed before the next survey launches. That timing is the entire point.
The argument about who owns engagement always happens after the results land, never before, and by then the person holding the deck is the person who owns the number.
I have run Talent Acquisition at 250+ hires a year inside exactly this tension: building the system while line leadership held every structural lever that determined whether the system could work. In 2025 I was recognised with an internal transformation award as a "Key Enabler of Transformation", and the word that matters in that phrase is enabler. It describes the job accurately, and it is the honest frame for what HR does here, a frame that runs through the HRBP operating model as well.
HR builds the system; it does not run the events
Five deliverables. Each one shippable, each one with an owner and a cadence.
- A measurement instrument that is short, frequent, and trusted. Owner: HR analytics. Cadence: reviewed annually, fielded per the architecture rule.
- A driver model that separates inputs from outputs before any action plan is built. Owner: HR. Cadence: revalidated each cycle.
- A manager enablement programme with real time allocated, not added on top. Owner: HR with leadership funding. Cadence: continuous.
- Action-loop governance with a published turnaround commitment. Owner: HR. Cadence: 30 days from results, every cycle.
- Analytics connecting engagement movement to business outcomes. Owner: HR analytics with Finance. Cadence: quarterly to leadership.
Now the harder half. Stop owning the engagement event calendar, stop chasing survey completion rates, and stop writing the action plans that managers should be writing themselves.
Every hour spent running an engagement activity is an hour not spent fixing the system that made the activity feel necessary.
⚠ WATCH OUT
Common mistake: the event-calendar trap closes slowly and it closes for good reasons. Somebody has to organise the thing, HR is competent and available, and within two years the engagement function is an events function with a survey attached.
You will not get out of it by declining. You get out by shipping the five deliverables above and handing local execution to managers who have the capacity to do it.
The structural shift is the same one I made in recruitment. Stop treating hiring as a linear plan that restarts with every vacancy and start treating it as a circular supply chain that predicts demand and maintains inventory, which is what the Talent Supply Chain framework does.
Engagement needs exactly that conversion. A maintained system, not a series of campaigns.
The accountability trap
HR is routinely held accountable for an engagement number driven by decisions HR does not make. The restructuring pace, the span of control, the promotion freeze, the reversal announced by memo.
The trap closes the moment you accept the target without negotiating the levers.
◆ FROM THE LAB
The Sofia lens: here is the escape, and it happens at target-setting, not at review time. Bring the driver model into the room. Identify which drivers HR controls and which leadership controls, on the same page, in front of everyone.
Then split the KPI. HR is measured on system delivery: manager enablement completion, action-loop turnaround time, and instrument response quality. Leadership takes the aggregate engagement score, because leadership holds the structural levers that move it.
My position on this comes straight from the retention work. Systems determine outcomes, not sentiment, and the practitioner's job is to own the system and be explicit in writing about what sits outside it. That is the same standard I apply to HR metrics that survive scrutiny.
◆ PRO TIP
The catch: this conversation is uncomfortable and it has to happen before the number is bad. Raised after a poor result, it sounds like an excuse. Raised at target-setting, it sounds like operating discipline.
Most people know this and still delay it, because the pre-emptive version costs political capital and the post-hoc version only costs a review rating. That is a bad trade and it is the one most of us make.
Employee Engagement in the Workplace: What it Looks Like in Practice
Read the top-ranking articles on this term and you will meet the same worker every time. Desk, laptop, hybrid schedule, Slack, a calendar they mostly control.
In a lot of organisations that person is the minority. The plant floor, the shift roster, and the distributed operation carry the headcount, and they are invisible across the entire search result.
The knowledge-worker workplace
Here's the deal:
This ground is well covered, so I will keep it short. Engagement for desk-based teams looks like a one-to-one cadence that survives a busy quarter, work that is visible with clear ownership, and asynchronous decision records so nobody is excluded by timezone.
Then there is the killer nobody names: calendar saturation. A knowledge worker with no unbroken two-hour block cannot do the work that produces engagement, regardless of how they feel about the company.
That is why capable people can deteriorate visibly while the sentiment data stays flat. They are not disengaged from the organisation, they are structurally prevented from doing the work. Audit protected focus time as an engagement driver, the way you would audit any other input, which is the argument behind treating meeting load and productivity as a people metric rather than an operations one.
The frontline and shift-based workplace

Standard engagement practice fails on the plant floor for reasons that have nothing to do with attitude. They are arithmetic and infrastructure.
No corporate email address, so the survey link never arrives. No scheduled one-to-one, because the supervisor is running the line. A span of control of 30 to 50, which makes individual attention mathematically impossible. And survey windows that land during a shift change.
But here is the catch:
Every workaround has to fit inside the existing shift structure. If a recommendation requires a supervisor to find extra time, it is the wrong recommendation and it will be dead in six weeks.
1
Move the instrument to where people already are
Kiosk-based or SMS pulse items at the shift entry point, three questions maximum. No login, no corporate email dependency, no link that expires before the night shift sees it.
2
Use the shift handover as the touchpoint
The handover already happens, it already has the whole crew's attention, and it already covers what went wrong. Add two minutes for what is blocking the work and you have a functioning voice mechanism that costs nothing.
3
Build the check-in into the shift, not on top of it
A five-minute supervisor-led check-in with a rotating subset of the crew, inside paid time. At a span of 40 that gives every person a real conversation roughly monthly, which beats an annual one-to-one that never happens.
4
Make recognition visible on the floor
A named recognition on the board at the line, not an email to an address nobody checks. Recognition that the crew cannot see is recognition that did not happen.
⚠ WATCH OUT
Red flag: benchmarking a frontline population against your corporate population. The constraints are entirely different, so the gap you find is structural, and you will misread it as a performance failure in a supervisor who is doing a competent job under impossible arithmetic.
Benchmark frontline against frontline. Always.
◆ FROM THE LAB
Real implementation: engineering and manufacturing hiring is where I have spent most of my career, and one campaign taught me more about engagement mechanics than any survey I have run.
The requirement was 350 to 500 hires across customer support, operations analysts, junior engineers, and sales support, inside 8 to 12 weeks, against an aggressive business ramp-up. Limited interviewer capacity. High drop-off risk. Every condition that normally destroys quality at volume.
We planned capacity backwards from the business start date, forecasting recruiter bandwidth and interviewer availability week by week rather than hoping. We simplified screening to standardised pre-assessment criteria, moved to batch interviews with structured scorecards, and ran daily recruiter stand-ups against a real-time tracker. Weekly war-room calls kept hiring managers inside the process instead of adjacent to it.
We delivered 420+ hires in 10 weeks. Turnaround Time (TAT) fell from 32 days to around 18 to 20. Offer-to-join came in above 90%, recruiter productivity rose by roughly 35%, and 90-day retention held at 85 to 88%.
Here is the engagement lesson, and it is the whole reason I am telling this story in an engagement article. That 90-day retention number was not protected by the sourcing strategy or the interview volume. It was protected by two design choices: a single point of contact per batch, so nobody was ever talking to a queue, and structured pre-joining engagement in the gap between offer and start date.
Engagement mechanics, applied at scale, before day one. That is the operating logic behind high-volume hiring systems that hold their quality.
The hybrid workplace
Hybrid engagement is not a sentiment problem. It is a coordination problem, and framing it as sentiment sends you straight to virtual coffee chats.
The real risk is that information asymmetry becomes structural. Decisions made in the room do not reach the people who were not in it, and after two cycles those people correctly conclude they are peripheral.
The old way
- Mandate office days to fix connection
- Measure attendance and call it engagement
- Run virtual social events for remote staff
- Let decisions live in whoever was in the room
The Lab Way
- Make written decision records the default
- Measure inclusion in decisions, not presence
- Rotate who runs the meeting
- Choose anchor days for collaboration, not attendance
⚠ WATCH OUT
Anti-pattern: using badge-swipe data as a hybrid engagement measure. It measures compliance with a policy and predicts nothing about effort or intent to stay.
Worse, your workforce knows it is being counted, which converts an attendance policy into a surveillance signal. Set the norms instead, the way hybrid team operating norms do it, and measure whether people are in the decisions rather than in the building.
Engagement Starts at the Requisition, Not at Onboarding
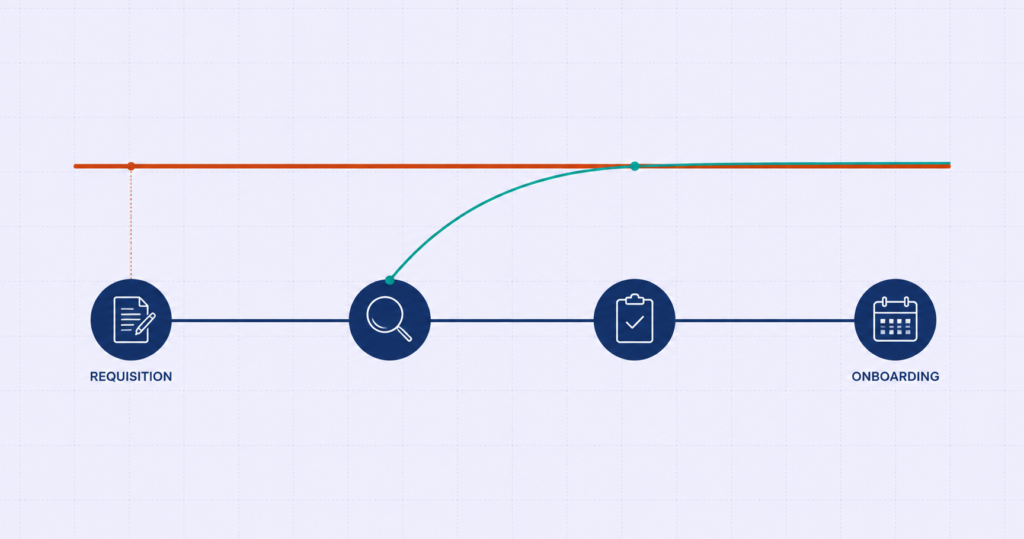
Every competing article treats engagement as a post-hire discipline that begins on day one. That framing is wrong and it is expensive.
Who you hire, how you assessed them, and whether you looked internally first all set the engagement ceiling before anyone signs anything.
How hiring quality sets the engagement ceiling
Here's the deal:
A person hired against a job description that misdescribed the work will disengage no matter how good their manager is. Role clarity, the strongest driver on the list, was broken at the requisition and no amount of one-to-ones repairs it.
A person hired through credential gatekeeping rather than capability assessment arrives without the specific capability the work requires. Disengagement follows competence failure, reliably, and usually inside two quarters.
Run the cohort audit. Break your engagement scores by hiring cohort, by sourcing channel, and by hiring manager, then look for the pattern.
If one channel or one hiring manager consistently produces low-engagement cohorts, you are looking at a selection defect presenting as an engagement problem. Almost no organisation runs this analysis, which is why the defect keeps getting funded as a culture initiative.
◆ FROM THE LAB
The Sofia test: we needed a manufacturing systems analyst, and traditional sourcing produced 14 qualified resumes. Fourteen, for a role the business needed filled that quarter.
So I inverted the funnel. Instead of filtering on resume keywords and degree lines, I searched for capability signals: PLC programming project work, lean manufacturing case studies, evidence that someone had solved this class of problem with their hands.
That produced 62 candidates. The person we hired had been a factory-floor supervisor who taught himself Python in his own time. He now leads digital transformation work.
Traditional screening would have removed him at the first filter, and here is why that matters in an engagement article rather than a sourcing one. Credential gatekeeping systematically eliminates the self-taught, and the self-taught are the people most likely to be highly engaged, because unpaid effort applied to learning is the same behaviour you are trying to buy after they join.
The quality data backed the method. Competition analysis lifted Quality of Hire by 12%, talent landscape analysis by 14%, and skill-based pipelines built on market analysis by 30%. That is the case for skills-based hiring in practice, and it starts at the requisition.
Internal mobility is an engagement engine, not an HR process
An employee who can see a realistic internal next step has a functioning career path. Career path visibility is a top-tier engagement driver, and a path that exists on paper but never moves anyone is worse than no path at all.
An internal move also resets the engagement clock. New challenge, new manager relationship, and institutional knowledge that stays in the building.
28 vs 67 days
Time-to-Productivity for internal hires against external hires under a First Look policy, a reduction of 40 to 50%. Internal moves accounted for 23% of all hires, and the 12-month cohort retention rate reached 89%.
◆ FROM THE LAB
Real implementation: the problem I was solving looked purely financial. External hiring cost was high and ramp time was slow, so the business case wrote itself on cost per hire alone.
The mechanism was deliberately small. A 48-hour internal posting window before any role went external, plus recruiters actively tapping internal candidates rather than waiting for applications to arrive.
Internal moves rose to 23% of hires. Those internal hires reached productivity in 28 days against 67 for external ones, and the cohort held 89% retention at 12 months.
But the return I did not forecast was the one that mattered most. The policy's real value was the signal it sent to everyone who did not move. Several hundred people saw roles appear internally first, every single time, and drew the obvious conclusion about whether this organisation looked inside before it looked outside.
That is an engagement intervention disguised as a recruitment policy, and it is the core of how I approach internal mobility programme design.
◆ PRO TIP
Real talk: internal mobility dies when managers are allowed to block moves to protect their own delivery numbers. They will do it quietly, with a reasonable-sounding timing objection, and within two quarters your policy is theatre.
Attach a manager incentive that makes releasing a high performer a rewarded act, and report internal release rates by manager. Without that, you have advertised a path that does not function, which damages engagement more than having no policy at all.
Read engagement through hiring behaviour, not just surveys
Now reverse the direction. Talent Acquisition data is an engagement instrument, and unlike a survey it runs continuously.
Why this works:
- Referral rate and referrer concentration. Engaged employees put their reputation behind an introduction. A collapsing referral rate is an engagement warning that arrives months before the survey does, and a shrinking pool of referrers tells you your advocates are going quiet.
- Silver medalist response rate. Whether former candidates return your calls tells you what the market believes about your employer reality, which is assembled from what your current employees say privately.
- Offer acceptance and offer-to-join conversion. Candidates talk to your people before accepting. A falling acceptance rate is often an engagement leak rather than a compensation problem, and treating it as compensation is how you inflate fixed cost without fixing anything.
Put all three on the same dashboard as your engagement score. Not in the Talent Acquisition report, on the same page, so the movement is visible against each other.
My own high-water marks give you a sense of what healthy looks like on these signals: 90% offer acceptance, and 82% referral conversion from an activated referrer against a 31% company average. On the silver medalist side, systematic re-engagement at 3, 6, 9, and 12-month intervals produced four hires over two years, one of whom became a team lead and another of whom went on to refer three external hires. That compounding is the point of the Silver Medalist Re-Engagement Loop.
How to Measure Employee Engagement Without Destroying Trust
Competitors explain survey mechanics competently. None of them address the thing every practitioner has lived through, which is the survey that produced no action and cost more trust than the data was worth.
Here's the difference:
Measurement is an architecture problem, not a question-wording problem. Get the architecture wrong and better questions will not save you.
The measurement stack: four instruments, four jobs
| Instrument | Its job | Cadence | Failure mode |
|---|---|---|---|
| Annual census | Full driver diagnosis across the population | Once a year | Becoming the only instrument you run |
| Pulse | Movement tracking on 5 to 8 items | Monthly or quarterly | Becoming a shortened census |
| eNPS | A single willingness-to-recommend trend line | Quarterly | Being used as a diagnostic |
| Behavioural signals | Continuous reading, unaffected by survey fatigue | Always on | Never being instrumented at all |
The behavioural layer is the one almost nobody builds. Absence patterns, internal application rate, referral rate, voluntary overtime, and meeting acceptance rates are all continuous, and none of them depend on anyone filling in a form.
Two architecture rules govern the whole stack. No more than one survey instrument in the field at a time, and every instrument has a named owner for the action that follows.
◆ PRO TIP
The honest downside: eNPS is a trend line and nothing more. It will tell you that something moved and it will never tell you what, which makes it useful for a board slide and useless for an action plan.
Run it if leadership wants a single number. Just never let it become the instrument that drives your intervention design.
At the mature end of the behavioural layer sit predictive models that read engagement and performance trends to flag likely leavers before they resign. I have worked with this and I rate it, with one caveat I always attach: if the training data carries historical bias, the model will reproduce that bias with more confidence than any human would.
Keep predictive retention work at aggregate trend level rather than scoring named individuals. Individual-level predictive scoring can engage automated decision-making provisions under GDPR Article 22 and emerging AI regulation, and the reputational cost of getting that wrong exceeds any retention gain. Vendor-neutral detail on this sits in people analytics without the vendor pitch.
The same transparency rule applies to the rest of the behavioural layer. Monitoring absence patterns, internal application rates, and meeting acceptance as engagement proxies carries works council, employee consultation, and privacy obligations across the EU, the UK, and several APAC jurisdictions. Tell people what you track.
What counts as a good employee engagement score?
There is no universal good score. The only honest benchmark is your own trajectory, then your industry and workforce type, in that order. For context, roughly 20% of employees globally are engaged, which means an organisation sitting at 35% is performing well above the global baseline even though 35% reads like a failure on a percentage scale.
That framing matters because a percentage triggers a school-grade instinct in every leadership team. Nobody looks at 35% and thinks "strong".
- Benchmark against your own prior cycle first. Direction and velocity beat absolute position, because they are the only part you control.
- Benchmark against your industry and workforce type second. A shift-based manufacturing population and a software team are not comparable, and comparing them tells you nothing you can act on.
- Never benchmark a frontline population against a corporate one. See the frontline section above for why that gap is structural.
⚠ WATCH OUT
Watch out: vendors sell benchmark databases that flatter. There is almost always a cut of the data in which your number looks acceptable, and a vendor with a renewal coming up will help you find it.
A benchmark chosen after seeing your result is not a benchmark. Choose the comparison set in writing before the results arrive, which is the discipline behind HR benchmarking done properly.
When the score is good and the attrition is bad
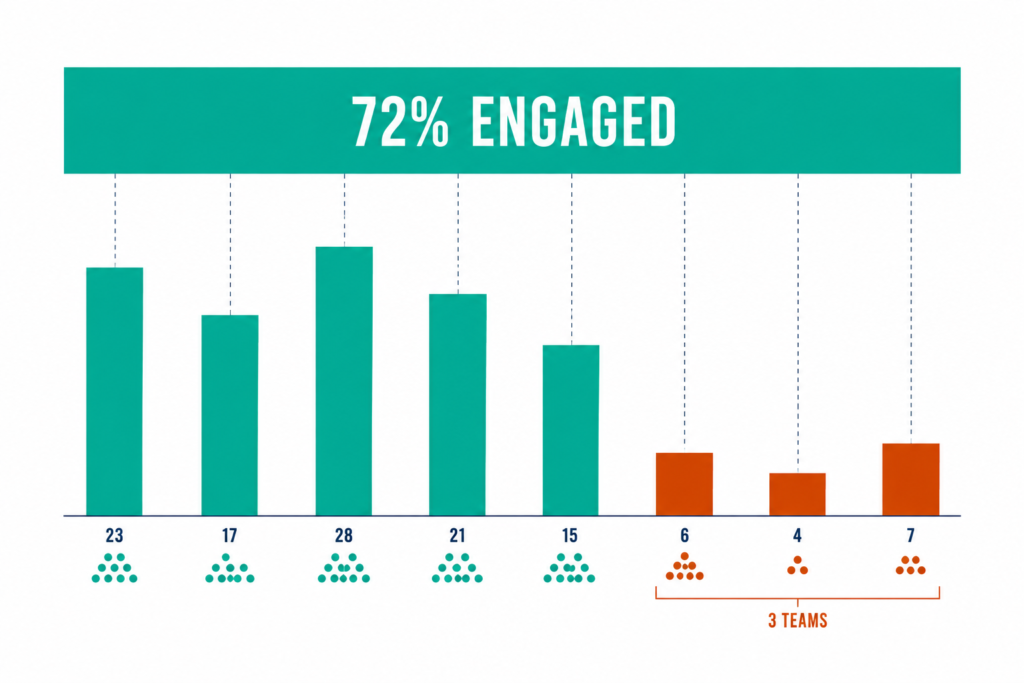
This paradox is absent from every ranking article and it lands in HR's inbox constantly. Healthy engagement score, critical people leaving anyway, and every explanation on offer is a guess.
Run these four checks in this order. Three of them are measurement failures. Only the fourth is not.
1
Disaggregate before you believe the org number
One large engaged population can mask three small collapsed ones and still produce a comfortable average. Break the data to the smallest reportable team unit and look at the distribution, not the mean.
Set a minimum reporting threshold of 5 responses, and check that threshold against your data protection obligations before you publish, because granular team reporting can risk re-identification in small teams.
2
Check response bias by team
If the disengaged did not respond, your score measures the engaged population only, and it will look excellent right up to the resignation. Check response rate team by team rather than overall, because a healthy company-wide rate hides the two teams sitting at 30%.
3
Check the timing against the trigger event
A survey fielded before a restructuring announcement, a leadership change, or a promotion freeze is a photograph of a different organisation. Map your survey window against the events calendar before you interpret anything.
4
Assess genuine external pull
People can be engaged and still leave for a market offer you were never going to match. This is the only one of the four that is not a measurement failure, and it is also the only one you should reach for last rather than first.
◆ FROM THE LAB
The Sofia lens: when the score is good and the attrition is bad, the reflex is to blame the instrument and start a vendor search. I have watched that decision cost a year and change nothing, because the new instrument measured the same undiagnosed problem with a nicer dashboard.
Run the four checks first. In my experience the defect is almost never in how people feel and almost always in measurement design or span of control, which is the same conclusion I keep reaching about retention: it is a systems failure, not a compensation failure. The diagnostic sequence for that sits in attrition analysis for HR.
How to Improve Employee Engagement: The Lab Operating Model
Everything above was diagnosis. This is the payload.
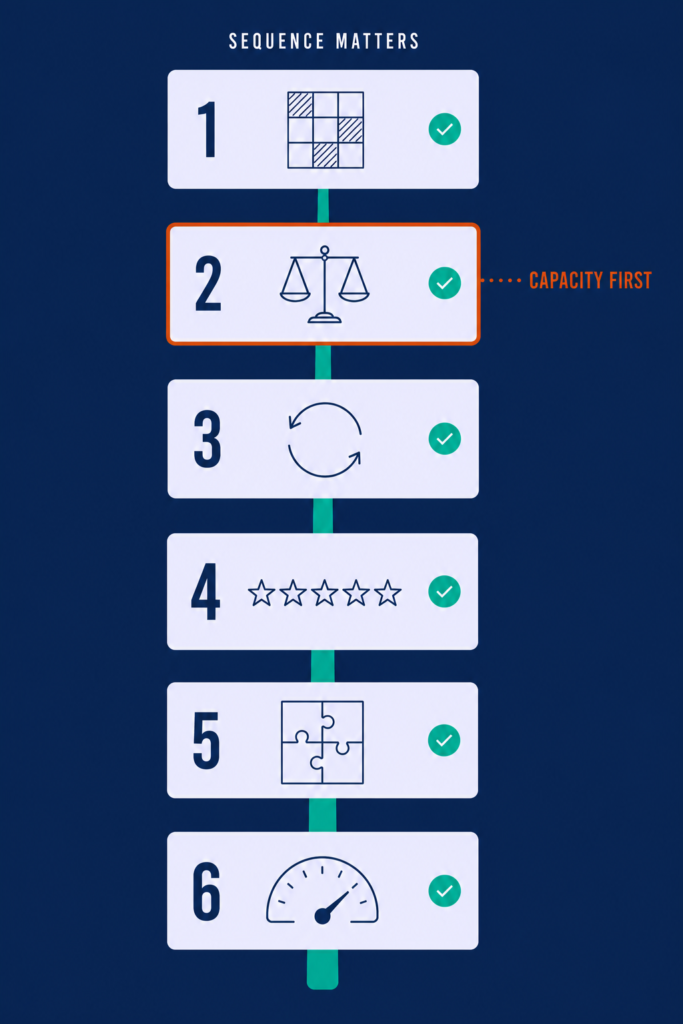
Six steps, each with an owner, a cadence, and a completion test you can hold someone to. The sequence is the differentiator, because most engagement work fails on ordering rather than on effort.
Here's how to build it:
1
Step 1: Diagnose at team level, not org level
Break the engagement data to the smallest reportable team unit before you design a single intervention. Nothing else in this model works if you skip it.
Set the minimum reporting threshold at 5 responses. Map every team into four quadrants using engagement score against attrition rate, then rank the quadrants by headcount at risk rather than by lowest score, because a 12-person team at 30% is a smaller problem than a 90-person team at 45%.
An org-level action plan applied to a distribution problem spends the entire budget on teams that never needed it. Owner: HR analytics. Cadence: once per survey cycle, before any action planning.
Completion test: you can name the five teams that account for the largest share of at-risk headcount, and you know which manager runs each one. That level of granularity is the point of team-level people analytics.
I take the same approach to hiring. Map the market continuously before the vacancy exists rather than reacting to a requisition, which is the whole idea behind intelligence-led sourcing. Map before you act, and map at the level where the problem lives.
2
Step 2: Fix manager capacity before manager training
Audit span of control and delivery load for every manager running an at-risk team, before you spend anything on enablement.
Pull direct-report counts. Add up individual delivery commitments. Flag any manager carrying more than 8 to 10 directs who also holds a full individual workload, because that person is not a development case, they are a structural one.
Training delivered to a manager with no capacity produces a manager who knows exactly what they should be doing and cannot do it. That is worse than no training, because it converts a structural problem into a personal failure and a competent person absorbs the blame.
Owner: HR with leadership. Cadence: before every enablement investment. Completion test: every at-risk team's manager has either a reduced span, a reduced delivery load, or a documented decision from leadership that neither will change. The third outcome is acceptable. Leaving it undocumented is not, and span of control and org design is where that decision belongs.
⚠ WATCH OUT
Common mistake: booking manager coaching as the first intervention. It is the most common recommendation in this entire search result and it is second in the correct sequence, not first.
If you have run manager training twice and watched behaviour revert within a quarter both times, you did not have a training problem either time.
Capability without capacity is not capability. It is a manager who knows what good looks like and no hours in which to do it.
The proof I trust here is my own. Recruiter productivity in that bulk campaign rose by around 35%, and every point of it came from batch interviewing and structured scorecards. Structural change, not motivational change, and the same arithmetic applies to a manager running a team.
3
Step 3: Close the loop within 30 days
Publish what changed as a result of the survey, within 30 days of the results landing, for every team surveyed.
Each manager selects exactly one thing their team raised, commits to a change, and reports the outcome at 30 days. One change. Not an action plan with nine items that quietly becomes a document nobody reopens. HR publishes the organisation-level equivalent in the same window, to the same standard.
The single largest destroyer of engagement is a survey that produced nothing, because it teaches the workforce that voice has no consequence. That lesson outlasts the survey cycle by years.
Owner: managers, governed by HR. Cadence: 30 days from results, every cycle, without exception. Completion test: every surveyed team can name one specific change that happened because of the survey. Ask three people at random, and if they cannot name it, it did not happen. That mechanism is what closing the feedback loop means.
◆ FROM THE LAB
Real implementation: the operating discipline that made a 420-hire campaign land in 10 weeks was not effort. It was cadence, and it was boring. Daily recruiter stand-ups, a real-time tracker everyone could see, and a weekly war-room call with hiring managers in the room rather than cc'd.
Short loops, visible status, named owners. Engagement action needs exactly that structure, because a commitment nobody can see the progress of is indistinguishable from a commitment nobody kept.
If you take one thing from this guide, take the 30-day loop. I write up frameworks like this one, with the real numbers attached, in the Lab newsletter every week if you want the next one before it goes public.
4
Step 4: Rebuild the recognition cadence
Replace episodic recognition with a specified frequency, owned by the direct manager.
Set a minimum of one specific, named recognition per direct report per month, referencing the actual work rather than the attitude. "The way you rewrote the handover checklist saved the night shift twenty minutes" beats "great attitude this month" by a distance, because only one of them proves someone was paying attention.
Add a peer channel with no approval workflow. Then remove the annual awards night from the engagement budget line if it is competing for the same money.
Recognition frequency is one of the few drivers that moves inside a single survey cycle, which makes it the right thing to run while the structural work from Step 2 is still landing. Owner: managers. Cadence: monthly. Completion test: recognition frequency is instrumented and reportable by team, the same way recognition programme design treats it as an operating metric rather than a sentiment.
◆ PRO TIP
Pro tip: do not buy a points platform as the primary intervention. The platform is not the driver, the manager's monthly act is, and a platform with 11% adoption is a licence fee with a dashboard.
The asymmetry from the referral data holds here too. Named status for the few outperforms a broad democratic programme, because recognition that everyone receives automatically signals nothing to anyone.
5
Step 5: Redesign the work, not just the culture
Change what the job contains for the roles with the lowest engagement.
Run a job-design review on your three lowest-engagement roles across four dimensions, then act on what it shows.
- What proportion of the role is work the person is genuinely good at
- How much of the role is administrative overhead that could be automated or removed outright
- Whether the role has a visible next step that someone has taken
- Whether decision rights match accountability, or whether the person owns the outcome without owning the call
Then remove one thing and add one thing per role. A role that scores low across multiple managers and multiple postholders is a job-design problem, not a people problem, and replacing the person again will not tell you anything you do not already know.
Owner: HR with the function head. Cadence: annually, or whenever a role fails twice. Completion test: at least one role has a documented before-and-after scope change.
◆ FROM THE LAB
The Sofia lens: this is where the AI conversation becomes honest instead of defensive. In my own function, AI took the high-volume, low-judgment work: scheduling, parsing, market mapping, and compliance workflows.
What came back was capacity for relationship-building, judgment, and influencing hiring managers, which is the work recruiters are uniquely good at and rarely have time for. The role became talent advisor rather than process manager.
That is job redesign in practice, and it is the reframe I would put in front of any anxious team: AI does not replace people, it replaces the parts of the job that stopped them being effective in the first place. Removing the administrative layer is an engagement intervention, which is why automating the administrative layer in HR belongs in this conversation rather than in a technology one.
6
Step 6: Instrument, re-measure, and publish
Put the engagement system on a standing dashboard and publish the movement, including when it moves against you.
Track five things.
- Team-level engagement trajectory, never the org aggregate alone
- Loop-closure rate: the percentage of teams that shipped their one change within 30 days
- Recognition frequency by team
- Manager span-of-control exceptions still open
- The Talent Acquisition signals: referral rate, internal application rate, and offer acceptance
Publish quarterly to leadership at the same disclosure standard you would apply to a financial metric. An engagement system that is not instrumented reverts to a survey programme within two cycles, and a survey programme is the first thing cut when budgets tighten.
Owner: HR analytics. Cadence: quarterly. Completion test: leadership sees the engagement dashboard on the same cadence as the operational dashboard, which is the standard set by HR dashboards that leadership reads.
Why Employee Engagement Programmes Fail
You are about to relaunch something. Before you do, work out precisely why the last one failed, because "it lacked leadership buy-in" is true, unhelpful, and in every competing article.
Here's the deal:
The five failure patterns
- Ownership diffusion. Engagement is everyone's responsibility, so nobody's target moves. The tell: nobody's objectives mention it. The fix: the four-way split, signed before the survey launches.
- Sequence error. Training before capacity, culture before job design. The tell: the same intervention has been run twice with the same result. The fix: Step 2 of the Lab Operating Model, in order.
- Loop failure. Surveys with no published change. The tell: falling response rate, which people misread as apathy rather than as a verdict. The fix: Step 3, the 30-day loop.
- Aggregation blindness. Org-level action on a team-level problem. The tell: the action plan is word-for-word identical across every business unit. The fix: Step 1, disaggregate first.
- Metric substitution. Measuring participation, satisfaction, or platform usage instead of engagement. The tell: the executive report leads with a response rate. The fix: Step 6, instrument the five things that matter.
⚠ WATCH OUT
Anti-pattern: relaunching with better communication and a new platform. That combination treats a system defect as a marketing defect, and it is the most expensive way to learn that it is not.
Diagnose against the five patterns, find your specific tell, and fix the sequence before you relaunch anything.
Every one of those five is a system defect rather than a people defect. That has been the spine of this entire guide, and it closes here.
The survey-as-theatre problem
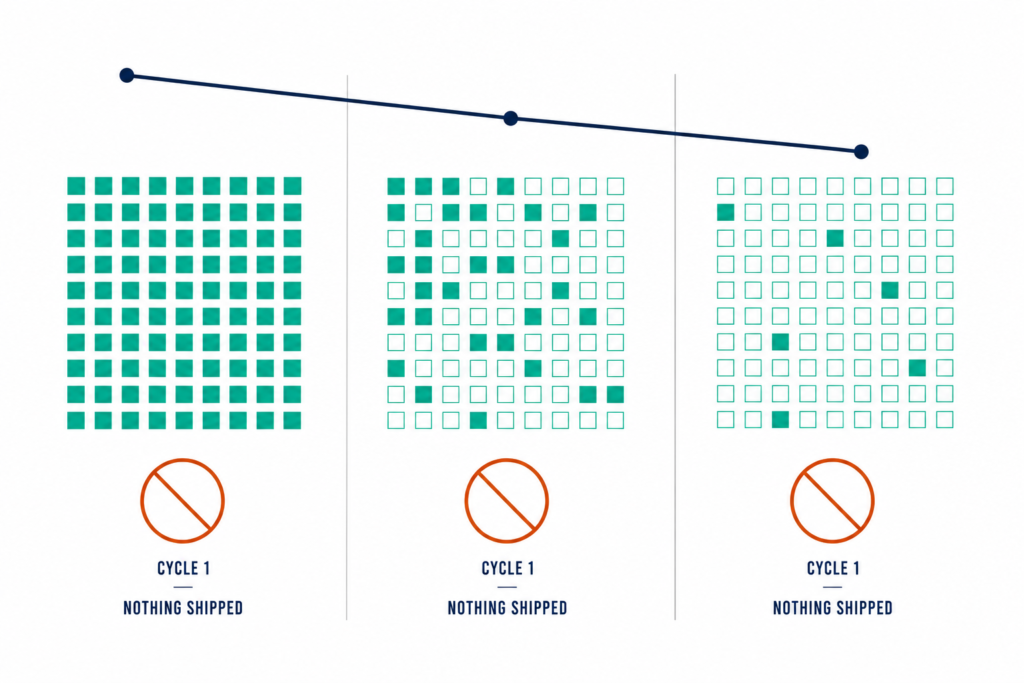
In a lot of organisations the annual engagement survey has become a ritual that costs more trust than the data returns.
Employees complete it. Nothing observable changes. The following year they either do not respond, or they respond strategically, which is worse because it looks like data.
At that point the instrument is not measuring engagement. It is measuring how many people still believe the exercise is real.
◆ PRO TIP
Real talk: if you cannot commit to closing the loop within 30 days, do not run the survey this cycle. Running it and doing nothing is more damaging than not running it at all, and everyone involved knows that before it goes out.
You have to earn the right to ask. The recovery path is a smaller instrument, a shorter loop, and one visible change, rebuilt over two cycles until people answer honestly again. Start with closing the feedback loop in 30 days and let the instrument grow back afterwards.
Frequently Asked Questions
What are the four levels of employee engagement?
Most models use three states: engaged, not engaged, and actively disengaged. Four-level models split the engaged group into highly engaged and moderately engaged. That fourth level is a threshold choice rather than a distinct psychological state. What matters operationally is which state each team sits in and what behaviour proves it, not how many boxes the model has.
What is the difference between employee engagement and employee satisfaction?
Satisfaction measures how employees feel about their conditions; engagement measures the effort they apply and their intent to stay. A satisfied employee can be completely disengaged, and that combination is the most expensive blind spot in HR. They like the pay, the flexibility, and the team, and they deliver the minimum scope. See the four-way distinction above.
Who is responsible for employee engagement in an organisation?
Four owners: leadership funds the conditions, HR builds the system, managers run it daily, and employees participate honestly. Saying engagement is everyone's responsibility is how accountability disappears, because no single objective moves. Write the split down and get it signed before the survey launches, not after the results arrive.
What are the main drivers of employee engagement?
Role clarity, manager quality and cadence, development and skill progression, recognition frequency, autonomy within a defined scope, voice with visible consequence, and functioning internal mobility. Role clarity is the strongest and cheapest. Several commonly cited drivers are outcomes in disguise, and investing in those produces campaigns rather than change.
How do you measure employee engagement?
Use a four-layer stack: an annual census for diagnosis, a short pulse for movement, eNPS as a trend line only, and behavioural signals for continuous reading. Two architecture rules hold it together. Keep one survey instrument in the field at a time, and give every instrument a named owner for the action that follows it.
What is a good employee engagement score?
There is no universal benchmark. Roughly 20% of employees globally are engaged, so an organisation at 35% is performing well above baseline despite how the percentage reads. Three rules: benchmark your own trajectory first, compare against a matched industry and workforce type second, and never benchmark a frontline population against a corporate one.
The Sequence is the Strategy
Eight years in, the mistake I made longest was believing engagement was something you communicate your way out of. It is not.
Engagement is a systems problem, and the system that broke first was the manager layer.
The gap between intending to fix this and fixing it is the defining problem of 2026. Deloitte found 85% of leaders say building workforce adaptability is critical while only 7% report succeeding at it, and just 27% say their organisations manage change effectively.
Source: Deloitte, 2026 Global Human Capital Trends, 4 March 2026
What separates the 7% from the 85% is not budget and it is not intent. It is sequence.
Capacity before training. Loop closure before instrument redesign. Job design before culture campaigns. Run those in the wrong order and you will spend a year proving that a well-funded programme can still fail.
So do not take all six steps. Pick two. One structural, from Step 2 or Step 5. One cadence, from Step 3 or Step 4. Run them for 90 days against a named owner and a completion test, then measure what moved before you touch anything else.
I write up frameworks like this one every week in the Lab newsletter, with the real numbers attached and the failures included. And if you are rebuilding this inside your own organisation, I want to hear how it goes, so connect with me on LinkedIn and tell me which two steps you picked.
