
In eight years inside a large global talent function, I watched benefits budgets get approved, spent, and quietly ignored.
Most organisations can tell you exactly what their benefits package costs. Almost none can tell you what any single line item did.
A benefits package is not a list of things you offer. It is a budget line with a utilisation rate, and almost nobody measures the second half.
That gap would matter less if the line were small. It is not.
31.6%
Share of total compensation spent on employee benefits for civilian workers, at $15.60 per hour worked, March 2026.
Source: U.S. Bureau of Labor Statistics, Employer Costs for Employee Compensation, March 2026
Translation: roughly a third of every compensation dollar you spend goes to benefits. On a 500-person workforce that is not a perk budget. It is one of the three largest lines in your P&L.
It is also the only line of that size where provision gets reported every year and consumption never does. Your finance team knows what the package cost. Nobody in the room knows what it bought.
Here’s what this guide contains:
- The statutory floor, with the headcount thresholds that switch each obligation on
- 24 categorised examples, each carrying a cost signal and a utilisation signal
- The arithmetic for deriving your own per-employee number instead of borrowing a national average
- What lands on a W-2 and what does not
- A seven-step build blueprint you can run against next year’s budget
- The utilisation audit that tells you what to cut
The Lab approach:
Every other guide on this topic is additive. It tells you what to add, ranks the additions by popularity, and stops. We treat the package as an instrument instead: a defined budget envelope, a segmented design, a utilisation signal per line item, and a fixed review cadence that is allowed to subtract.
What are Employee Benefits?
Employee benefits are the non-wage components of total compensation an employer provides, including insurance, retirement contributions, paid leave, and other services. Employers deliver them either because law requires them or because they choose to offer them to attract and keep people. For a budget holder, they are the portion of pay an employee never sees arrive in their bank account.
That last point does more work than it looks like it does. Benefits are compensation, not generosity, and the sooner a package is discussed as part of the full compensation envelope rather than a separate goodwill budget, the sooner it survives contact with Finance.
They are also contractual or policy-bound. A benefit has an eligibility rule, a forecastable cost per head, and usually a defined tax treatment. That is what separates it from a discretionary convenience, and it is why benefits carry weight in the decisions that keep people in a role in a way that a snack budget never will.
Here’s the difference:
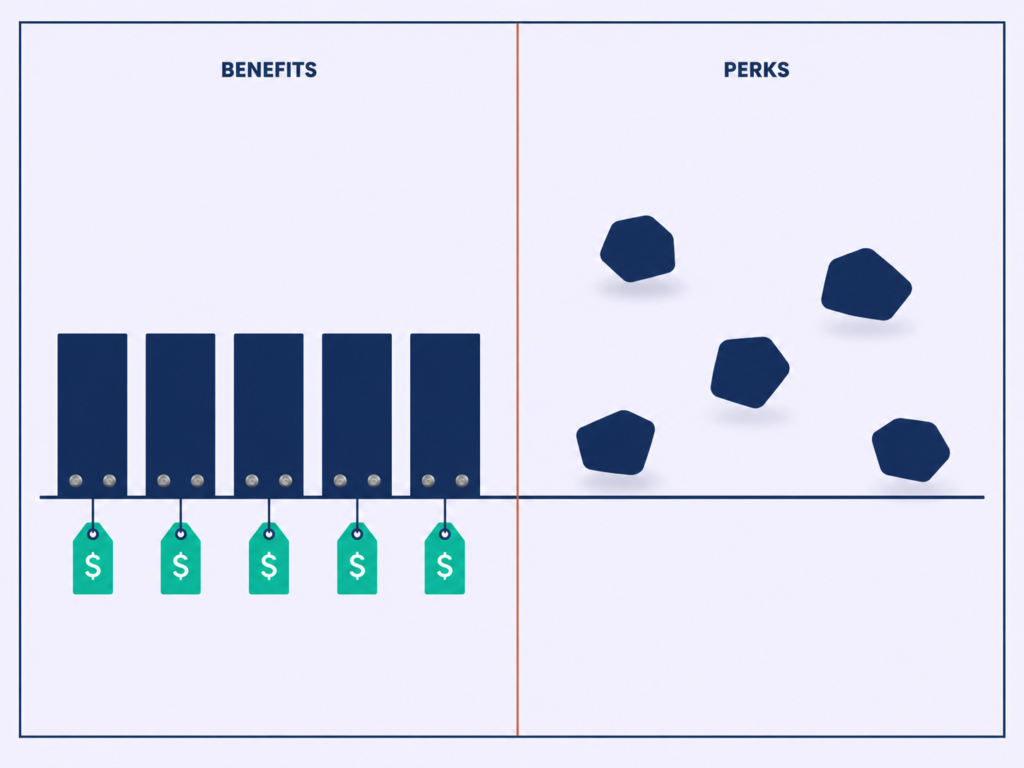
Benefits are policy-bound non-wage compensation with an eligibility rule and a per-head cost you can forecast. Perks are discretionary conveniences with neither. Total rewards is the whole envelope: base pay, variable pay, equity, benefits, perks, and career value.
Put them on one line and the boundary becomes obvious. A short-term disability plan is a benefit. A monthly office lunch is a perk. A visible promotion path is neither, and it belongs in your total rewards strategy alongside both.
◆ FROM THE LAB
The Sofia test: at enterprise scale, I learned to sort the two with one question. A benefit is anything you would have to formally withdraw. A perk is anything you could stop doing on a Tuesday.
It sounds crude. It has never once given me the wrong answer, and it settles budget arguments faster than any policy document I have written.
Why this matters:
Finance will fund a benefit and interrogate a perk. The two get budgeted differently, taxed differently, and communicated differently, so presenting them on the same slide invites the scepticism the perks earned to spread across the whole package.
⚠ WATCH OUT
Common mistake: listing food and beverages, or gifts and activities, at the same structural level as a retirement plan. Several of the most-read guides on this topic do exactly that.
The reader comes away with a fuzzier vocabulary than they arrived with, and the person who has to defend the spend inherits the confusion.
Mandatory vs. Voluntary Benefits: What US law requires
Ask most HR teams where their legal floor sits and you get a version of the same answer: payroll handles it. That answer is how organisations either over-provide out of caution or find a gap during an audit.
The floor is the only part of your package you cannot design. Everything above it is a choice you will be asked to justify, which makes knowing exactly where the line falls the first piece of real work.
The benefits US employers are legally required to provide
Federal law sets the base layer, and states stack obligations on top of it. Here is the floor, named precisely.
| Requirement | Who it applies to | What the employer must do |
|---|---|---|
| Social Security and Medicare (FICA) | Effectively all employers | Match the employee’s share of contributions and remit through payroll |
| Unemployment insurance (FUTA and SUTA) | Employers meeting federal and state tests | Fund federal and state unemployment insurance taxes |
| Workers’ compensation insurance | State-mandated; rules vary by state | Carry coverage that meets the state’s requirements for the workforce and worksite |
| FMLA leave | Covered employers, with employee eligibility conditions | Provide unpaid, job-protected leave and maintain group health coverage during it |
| COBRA continuation coverage | Group health plans of covered employers | Offer continuation of group health coverage to qualified beneficiaries |
| ACA employer shared responsibility | Applicable Large Employers | Offer coverage meeting affordability and minimum value standards, or face a payment |
| State mandates | Jurisdiction-dependent | Meet state paid sick leave, paid family and medical leave, and retirement auto-enrolment rules where they apply |
Every threshold and obligation above should be checked against the governing federal or state source before you publish a policy on it. Rules move, and a package built on last year’s reading of them ages badly. If you are formalising any of this, treat it as part of your wider employment law and policy work rather than a one-off task.
⚠ WATCH OUT
Watch out: a policy that is fully compliant federally can still be non-compliant in California, New York, Colorado, or Washington. The state layer is where multi-site employers get caught.
If you employ people in more than one state and your benefits policy has one national version with no state annexes, you have a gap. You just have not found it yet.
The headcount thresholds that change your obligations
Size is what converts an optional benefit into a legal requirement. Three thresholds do most of the work, and each should be verified against its current federal source before you act on it.
| Threshold | Generally triggers at | What switches on |
|---|---|---|
| ACA employer shared responsibility | 50 or more full-time and full-time-equivalent employees (Applicable Large Employer) | Obligation to offer compliant health coverage, plus annual reporting |
| FMLA | Private employers with 50 or more employees within 75 miles of the worksite | Unpaid job-protected leave for employees meeting the 12-month and 1,250-hour conditions |
| COBRA | Group health plans of employers with 20 or more employees | Continuation coverage rights and the notice machinery behind them |
Read that table as a forecast, not a status check. A company crossing 50 heads acquires two new obligations in the same year, usually with nobody flagging it, and growth-stage organisations tend to discover this retroactively.
The fix is not legal. It is planning. In the campaigns I have run, weekly hiring targets were always mapped backward from the business start date so recruiter bandwidth was forecast rather than discovered, and benefits obligations deserve the same treatment: put the thresholds on the headcount forecast so the obligation is budgeted the quarter before it triggers.
⚠ WATCH OUT
Watch out: the 50-employee year is the one that catches people. Two obligations arrive together, both carry reporting, and neither announces itself.
What ERISA governs, and what it does not
ERISA does not require an employer to offer a plan. It sets minimum standards for most voluntarily established retirement and health plans in private industry, which means it governs the plan once you have chosen to offer one.
Operationally, that means five things: fiduciary responsibility for those managing plan assets, written plan documents, Summary Plan Descriptions for participants, reporting and disclosure obligations, and enforceable participant rights.
The exclusions surprise people. Government plans and church plans are generally exempt, and certain payroll practices and genuinely voluntary arrangements fall outside it. The Employee Benefits Security Administration at the Department of Labor is the governing body, and it is the right first stop when a question is genuinely about scope.
None of this is a compliance manual. It is orientation, and it matters because most people inheriting a benefits programme have no idea what exposure came with it. If you own plan governance, it belongs in the same conversation as the rest of your HR governance architecture.
◆ PRO TIP
Real talk: the fiduciary duty sits with the plan sponsor. The plan sponsor is the organisation. The organisation, in practice, is you.
Your broker advises. Your broker does not hold the duty, and discovering that during a dispute is an expensive way to learn it.
The 4 Major Types of Employee Benefits
The four major types of employee benefits are insurance, retirement, time off, and additional or fringe benefits. Insurance covers medical, dental, vision, life, and disability. Retirement covers 401(k) and 403(b) plans, pensions, and employer contributions. Time off covers PTO, holidays, sick leave, and parental leave. The fourth category absorbs everything else.
Those four are not equal in cost or in weight. Insurance is the largest block in almost every package and the one employees notice first. Retirement follows, with a cost that scales with participation rather than headcount, which makes it behave differently from every other line.
Time off costs less in cash than people assume and more in coordination than anyone budgets for. The fourth category, the fringe bucket, is the one nobody prices in aggregate.
The ordering is not arbitrary, and the employer market confirms it. Health coverage is offered by 97% of surveyed employers, and 88% of HR professionals rate health care benefits very or extremely important to their workforce, ahead of leave benefits and retirement savings at 81% each, flexible working at 68%, family care at 67%, and professional development at 65%.
Source: SHRM, 2025 Employee Benefits Survey
Here is the limit of this model:

The fourth category is not a category. It is a residual bucket, defined by what does not fit the other three, which is a description of the market rather than a design framework.
That distinction has a price. Because nothing in the fourth bucket shares a cost behaviour, a tax treatment, or an eligibility logic, it never gets reviewed as a block, and items accumulate in it for years without anyone summing them.
That fourth bucket is where the money goes missing.
◆ PRO TIP
The catch: I have sat through a lot of annual benefits reviews, and I have never seen one where the fourth category was reported line by line with a cost against each item. It gets presented as a single figure or as a list of names with no numbers attached.
Use the four-box model to describe what exists. Do not use it to design. We come back to that bucket, with a method, further down.
One category note before the examples. The fringe benefits in that fourth bucket are also where almost every tax question in this article lives, which is another reason they deserve to be handled as individual decisions rather than a leftover pile.
24 Employee Benefits Examples, by Category
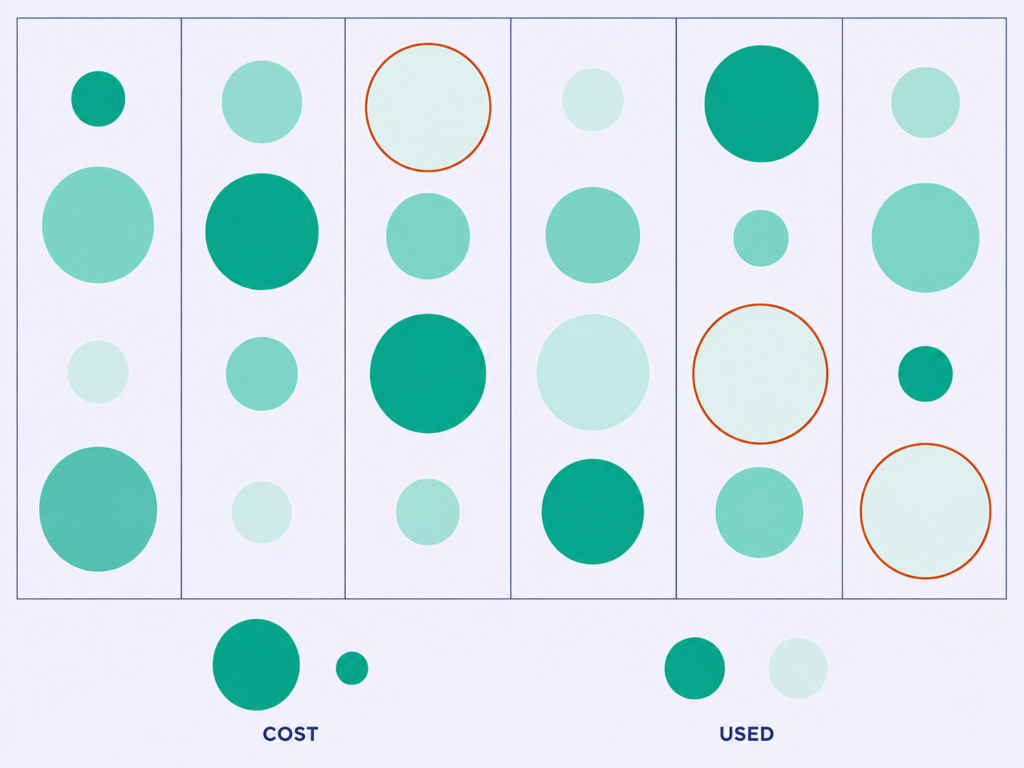
Most lists of employee benefits examples tell you what exists. Almost none tell you what any of it costs you or whether anyone uses it.
Here’s how to read this list:
Every one of the 24 below carries two signals a standard listicle leaves out. A cost signal, meaning high, moderate, or low relative employer cost, and whether that cost is fixed per head or driven by usage. A utilisation signal, meaning how reliably the benefit gets consumed by the people eligible for it.
Those two signals are what turn a list into a budget document. Read them together and you can see which lines are expensive and loved, which are cheap and loved, and which are quietly funded and untouched.
Health and insurance benefits
1. Health insurance. Employer-sponsored medical coverage, usually cost-shared with the employee through premiums and plan design. It is the anchor benefit for every workforce segment and the one whose absence ends a conversation. Cost signal: highest fixed per-head cost in the package, and the line that moves most at renewal.
2. Dental insurance. Routine and restorative dental cover, typically a small fraction of the medical premium. It matters most to employees with families, and it produces steady, visible claims. Cost signal: low fixed cost, strong utilisation, high satisfaction per dollar.
3. Vision insurance. Eye exams, lenses, and frames, usually the cheapest insurance line you will buy. It is used by a wide slice of the population every year or two. Cost signal: lowest cost in the insurance block, and the best satisfaction-per-dollar ratio of anything you offer.
4. Life and AD&D insurance. Employer-funded death and dismemberment cover, often at a multiple of salary. Visible utilisation is close to zero, which is exactly the point. Cost signal: low fixed cost, near-invisible in a good year, catastrophic to be without in a bad one.
5. Short-term and long-term disability. Income replacement when an employee cannot work. It matters most to single-income households and hourly populations, and it is the benefit employees are least likely to know they have. Cost signal: moderate fixed cost, chronically under-communicated, and the clearest case in the package where awareness genuinely is the constraint.
6. Supplemental and voluntary coverage. Critical illness, hospital indemnity, and accident cover, usually employee-paid or cost-shared. It appeals to employees carrying deductible exposure they cannot absorb. Cost signal: very low employer cost because the employee funds most of it, which is precisely why this block is growing.
That growth is measurable, and it points at something bigger than product preference. Critical illness insurance reached 53% of employers in 2025, up from 51% in 2024 and its third consecutive year of growth, and hospital indemnity recorded the largest year-over-year increase of any benefit in the survey. Over the same period medical FSAs fell to 60% of employers, from 63% in 2024 and 68% in 2021, and dependent care FSAs fell to 54%, from 58% and 65%.
Source: SHRM, 2025 Employee Benefits Survey Executive Summary
Read those two movements together and the direction is clear. Employers are shifting toward products that add perceived value without adding fixed employer cost, and away from accounts that carry heavy administration for a shrinking pool of users. That is a rebalance, not a retreat, and it is worth knowing which side of it your package sits on.
One caution on the insurance block. Buying it as a single annual decision from a single broker is how packages ossify, and it is why upgrading medical cover so often crowds out the cheap lines that were doing the most work per dollar. If you are pairing coverage with employee wellbeing programmes, price them separately or the wellbeing spend will hide inside the renewal.
Retirement and financial benefits
7. 401(k) or 403(b) with employer match. A tax-advantaged retirement plan with an employer contribution attached to employee deferral. It matters across every segment, with weight increasing sharply past mid-career. Cost signal: high, but usage-driven rather than per-head fixed, because you only pay for participation.
That cost behaviour makes match design a real lever, and most organisations never touch it. A match formula inherited from a previous administrator, applied to a participation rate nobody has segmented, is not a design decision. It is a default.
8. HSAs, FSAs, and HRAs. Tax-advantaged accounts for health and dependent care spending, funded by the employee, the employer, or both. They matter most to higher-income employees, where the tax shelter is worth more. Cost signal: low direct employer cost, high administrative load, and the block currently shrinking fastest.
9. Student loan repayment assistance. Direct employer contributions against an employee’s education debt. Value is sharply segmented, high for early-career hires and close to zero for late-career ones. Cost signal: moderate and usage-driven, with one of the cleanest attribution stories of any benefit on this list.
10. Financial wellness and planning access. Advisory sessions, planning tools, or subsidised access to a financial professional. It matters most at moments of change, not in the abstract. Cost signal: low, and almost always poorly used unless it is embedded in a specific moment such as onboarding, a promotion, or a life event.
11. Equity, stock options, and ESPP. Ownership or discounted purchase rights in the business. It matters most to employees who understand the instrument, which is a smaller group than most companies assume. Cost signal: no cash cost, real dilution cost, and the benefit most often misunderstood by the people receiving it.
This block is gaining ground for a reason. Employee preferences have moved toward financial stability and security, and toward future base pay increases and long-term incentive design over short-term incentives and merit differentiation, which favours retirement and equity against almost everything else on this list. If you are rebalancing, start with compensation benchmarking against the roles you compete for rather than against a national median.
◆ PRO TIP
The catch: a match nobody claims is a budget you never spent and a benefit nobody received. Both halves are problems, and only one of them shows up in your accounts.
Unclaimed match looks like underspend at year end, which reads as good news to Finance and as a failed benefit to everyone else. Segment participation by tenure and pay band before you touch the formula.
Time off and flexibility
12. PTO, vacation, and sick leave. Paid absence, either accrued or granted as an annual allowance. It matters universally, and structure matters more than quantity. Cost signal: moderate, and the accrual-versus-unlimited decision changes the liability carried on your balance sheet.
13. Parental and caregiver leave. Paid or job-protected leave for new parents and employees caring for family. Value is intense within its segment and near zero outside it. Cost signal: high per user, low across the population, and currently contracting in the market, with paid leave for immediate family care down to 31% of employers from 33%, and extended family care down to 17% from 19%.
14. Sabbaticals and unpaid leave. Extended time away, typically tenure-gated. It matters most to long-tenure senior people, which is the group most expensive to replace. Cost signal: near-zero direct cost, real coverage cost, and a strong retention signal for the people who qualify.
15. Flexible and hybrid work. Discretion over where and when work happens, inside defined limits. It is the most broadly valued item on this list. Cost signal: no line-item cost at all, which is exactly why it is the benefit most likely to be quietly withdrawn.
16. Four-day week and compressed schedules. A reduced or restructured working week at unchanged pay. It matters most to populations with predictable, bounded workloads. Cost signal: the highest-variance option here, and the only one that requires an operating-model change rather than a policy change.
Several of these cost nothing in cash and a great deal in coordination. That is the honest accounting, and it is the reason leave policy fails more often on execution than on design.
An organisation offering 25 days that nobody feels able to take has a worse benefit than one offering 18 days with a manager norm that enforces them. The constraint is not the allowance. It is whether the coverage plan and the manager capability behind it make the allowance real.
⚠ WATCH OUT
Common mistake: announcing a leave benefit without a coverage plan behind it. The announcement creates the expectation, the absence of coverage creates the guilt, and utilisation lands below where it started.
Unlimited PTO is the clearest case. Uptake typically falls under unlimited policies unless a floor is mandated, which means the headline benefit and the delivered benefit move in opposite directions.
Family, health and life-stage benefits
17. Childcare and dependent care support. Subsidised care, on-site provision, or a dependent care allowance. It is enormously valuable to a narrow segment and worth almost nothing to everyone else. Cost signal: high per user, and the textbook case for a flex layer rather than a universal offering.
18. Fertility and family-building support. Coverage or reimbursement for fertility treatment, adoption, and surrogacy. Among the most retention-relevant benefits for the segment it serves. Cost signal: moderate to high, rising fast, and usage-driven within a small eligible population.
19. Eldercare and long-term care support. Navigation services, respite support, or insurance for employees caring for ageing relatives. It is the most under-served benefit relative to demographic demand. Cost signal: low to moderate, and disproportionately relevant to your most senior and most expensive people.
20. GLP-1 and weight-management coverage. Coverage for the drug class now offered by 23% of employers for type 2 diabetes, weight management, or both. It matters to a growing share of the population and to your medical trend line. Cost signal: the single hardest cost to forecast in the current package.
Number 20 deserves a decision frame rather than a verdict. The four variables that determine your exposure are coverage criteria, step therapy requirements, utilisation management, and whether you set a cost ceiling at all. Decide those four explicitly, because the alternative is an open-ended commitment made by default.
◆ PRO TIP
The honest downside: GLP-1 coverage is the hardest cost to forecast in the current benefits package, and anyone telling you otherwise is selling something. Demand is rising, the eligible population is wider than the historical claims data suggests, and your existing trend assumptions were built before this class existed.
These four are the strongest argument in the article for workforce segmentation. Funded universally, they dilute across a population that will never claim them. Funded through a segmented flex layer, the spend reaches the people it was designed for, which is the mechanism set out in the segmentation section further down.
Growth and development benefits
21. Tuition reimbursement and learning stipends. Employer funding for qualifications, courses, or self-directed learning. It matters most to ambitious mid-career employees, which is a high-retention-value group. Cost signal: moderate and usage-driven, so the budget rarely spends out, and typically the worst-measured line in the entire package.
22. Internal mobility and career pathing. A visible internal market with a formal rule giving existing employees first access to open roles. It matters to everyone with ambition and nowhere obvious to go. Cost signal: zero incremental cost, and the strongest retention evidence of anything on this list.
Number 22 belongs on a benefits list and almost never appears on one. It is a non-wage form of value the employer provides, it has eligibility rules, and it can be designed. That meets the definition set out at the top of this article in every respect.
◆ FROM THE LAB
My experience: at one point in my career I owned end-to-end hiring for a function with an expensive external pipeline and a slow ramp. External hires were taking more than two months to reach productive output, and we were paying agency fees for people whose skills already existed two floors away.
We introduced a First Look policy: a 48-hour internal posting window before any role went external, with recruiters proactively tapping known internal candidates rather than waiting for applications to arrive. The mechanism was simple. The resistance was not.
Managers protected their best people. Every one of them supported internal mobility in principle and objected to it the week their strongest analyst applied elsewhere. We handled it by making backfill support explicit and by treating a release as a managerial credit rather than a loss, which took two quarters to land properly.
The result: 23% of hires that year were internal moves. Time-to-Productivity ran at 28 days for internal hires against 67 days for external ones, a difference of more than five weeks per hire, repeated across every internal move we made.
The lesson transfers directly to benefits. Your best candidates are sometimes already on payroll, and the highest-return development benefit you own costs nothing to fund and everything to enforce.
The old way
- Fund a tuition programme
- Announce it once at launch
- Never look at who used it
- Post roles externally by default
- Report spend at renewal
The Lab Way
- Fund it against a defined capability gap
- Track uptake by level and tenure band
- Measure 24-month retention against a matched cohort
- Enforce an internal-first posting rule
- Report completion and progression, not spend
How to execute:
Pair the two. Instrument the tuition line so you can see uptake, completion, and what happened to participants two years later, and pair it with a formal internal-first hiring rule so progression is something people can see rather than infer. Done together, they turn internal mobility into a benefit with an operational return, and they give you a defensible Quality of Hire story at the same time.
Lifestyle, recognition and flexible spend
23. Lifestyle Spending Accounts. An employer-funded, employee-directed pool spent against a defined category list. It works across every segment precisely because each person points it somewhere different. Cost signal: fixed per head, fully forecastable, and it replaces a scatter of low-utilisation universal perks with one budgeted line.
24. Recognition programmes. Structured peer or manager recognition, sometimes carrying a monetary component. It matters most where the work is invisible to senior leadership. Cost signal: low, high frequency, and effective only when it is peer-driven and specific rather than periodic and generic.
The Lifestyle Spending Account is the most consequential structural development in this block, and it is not a trend story. It converts a set of universal low-utilisation perks into one budgeted, segmented, employee-directed line with a per-head cost you can put in a forecast.
The research now points the same way. Gartner’s 2026 work recommends removing under-utilised wellness benefits and redirecting that investment toward Lifestyle Spending Accounts, GLP-1 access, and fitness subsidies, which is a subtraction-funded addition rather than new spend.
Which brings us to the honest part of this section. Commuter support, employee discounts, pet insurance, snacks, and social events are perks. They can be good perks, and several of them are worth funding, but they are not employee benefits and they should not appear in a benefits package or a benefits budget.
Put them in the Lifestyle Spending Account or in a named perks budget instead. That is not pedantry. It is the difference between a package you can defend line by line and a list that gets challenged as a whole, and it is worth reading alongside what makes recognition land with the people receiving it.
⚠ WATCH OUT
Red flag: if you cannot state the annual cost of your perks in aggregate, they are not managed. They are accumulating.
Each one was individually cheap on the day it was approved. Five years of individually cheap decisions is how the fourth bucket becomes the third-largest line in the benefits budget without anyone deciding that it should be.
A benefit is anything you would have to formally withdraw. Everything else is a perk, and it belongs in a different budget with a different name.
Twenty-four examples, six categories, two signals each. The obvious next question is what the whole thing costs you, and that question has a worse answer than most people expect. Here is how to work it out properly:
What Employee Benefits Cost Per Employee
Ask what benefits cost per employee and you will be handed a national average. That number is close to useless for the decision you are making.
It is like being given the average house price and asked to buy a specific house. The figure is real, the arithmetic behind it is sound, and it tells you almost nothing about what you should budget.
Start with the baseline anyway, because you need it as an input. In March 2026, employer costs for employee compensation averaged $49.32 per hour worked for civilian workers, split into $33.72 in wages and salaries, 68.4% of the total, and $15.60 in benefits, 31.6%. For private industry workers the split was $32.60 in wages, 69.9%, and $14.01 in benefits, 30.1%. State and local government benefits accounted for 38.5% of total compensation.
Source: U.S. Bureau of Labor Statistics, Employer Costs for Employee Compensation, March 2026
Here is how to read it:
First, the headline is a percentage of total compensation, not a flat per-head cost. A high-comp engineering organisation and a high-volume operations organisation with identical headcounts will report very different benefits budgets and near-identical percentages.
Second, the figure includes legally required benefits, which you do not get to decide. Your discretionary envelope is materially smaller than the headline implies, and it is the only number that matters when someone asks you to add something.
Third, private and public sector diverge sharply, 30.1% against 38.5%. A public-sector benchmark is not a benchmark for a private employer, and mixing them is how a package gets described as underfunded when it is nothing of the sort. Model the statutory floor and the discretionary layer separately, and treat both as part of your total compensation picture rather than a standalone budget.
The implementation:
Five moves, run against your own numbers, and you can do it this week. The worked example below uses a hypothetical 400-person private-sector organisation with an average salary of $85,000.
| Move | What you do | Worked example |
|---|---|---|
| 1 | Take total annual wages and salaries, not headcount | 400 x $85,000 = $34,000,000 |
| 2 | Apply the sector ratio to derive the total benefits envelope | Benefits are 30.1% of total compensation and wages are 69.9%, so the envelope is $34,000,000 x (30.1 / 69.9) = $14,640,000 |
| 3 | Subtract the statutory floor: FICA match, unemployment insurance, workers’ compensation | FICA employer match at 7.65% of covered wages = $2,601,000. Unemployment insurance and workers’ compensation, modelled here, = $900,000. Replace both with your payroll’s actual figures |
| 4 | Subtract committed insurance cost at current plan design | Modelled at $8,200,000 |
| 5 | What remains is the discretionary envelope | $2,939,000, or about $7,350 per employee per year |
Note what move 2 does, because it is the step people get wrong. You cannot multiply your wage bill by 30.1% and call it the benefits envelope, since 30.1% is a share of total compensation rather than a share of wages. Skip that correction and you understate the envelope by roughly a third.
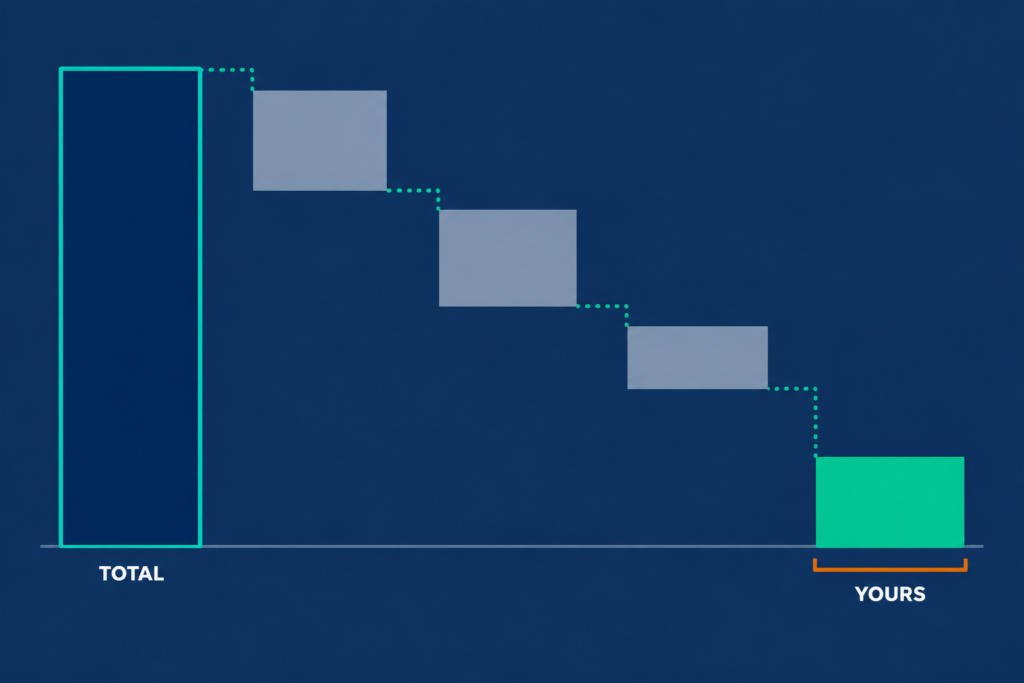
Now look at the last row. On a $48.6 million total compensation base, the genuinely discretionary layer is about 6%, or $7,350 per person per year.
Every argument you will ever have about adding a benefit is an argument about that number. Most organisations have never calculated it, which is why those arguments run for months and get settled on instinct.
I learned this discipline on the recruiting side, where the same failure shows up in a different currency. You cannot reduce a cost you have never decomposed, and cost per hire stayed stubbornly high in every team I inherited until we broke it into its parts.
Here’s the comparison nobody runs:
Set that per-employee discretionary figure against what it costs to replace one person. In the worked example above, the discretionary benefits spend is about $7,350 per employee per year.
◆ FROM THE LAB
The Sofia lens: in one of the organisations I worked with, agency fees on senior engineering hires ran at 18% to 22% of CTC. On packages of ₹45 to ₹50 lakh, roughly USD 54,000 to 60,000, that is ₹8 to ₹10 lakh per hire, or about USD 9,500 to 12,000.
The agency fee alone, on a single senior hire, exceeded a full year of discretionary benefits spend per employee in the model above. And the fee is the smallest component of replacement cost, sitting alongside vacancy drag, ramp time, and the productivity of whoever covered the gap.
We attacked it with direct sourcing, internal referrals, and pre-built talent pools. Agency reliance fell by 60% to 70%, four of six senior roles closed without an agency at all, and cost per hire went from ₹6.5 to ₹7.5 lakh down to ₹3 to ₹3.8 lakh. That is a 45% to 55% reduction, with Time-to-Fill improving from 70 to 80 days down to 45 to 50.
The point of putting those two numbers side by side is not that benefits prevent attrition. This article argues the opposite further down, and it argues it hard.
The point is that the two figures are usually an order of magnitude apart, and a leader defending the smaller one has no sense of the larger one. That asymmetry is worth naming before you walk into the budget meeting, and it is worth pairing with your actual retention data rather than an industry benchmark.
◆ PRO TIP
Real talk: this comparison justifies the conversation, not the line item. It is a reason to take the benefits budget seriously. It is not evidence that any particular benefit works.
Do not claim benefits pay for themselves. It is an unearned causal claim, your CFO will spot it in about four seconds, and making it costs you the credibility you need for the argument you can win.
What does meet that evidentiary standard is worth showing, because it is rarer than it should be. Here is one non-wage reward mechanism with a documented financial return:
◆ FROM THE LAB
Real implementation: earlier in my career I inherited a referral programme that looked healthy on paper and delivered almost nothing. Everyone was eligible, everyone got the same bonus, and the submissions were mostly polite noise from people forwarding a friend’s CV.
So we stopped treating it as a democratic scheme. We pulled two years of referral data, found the top 5% to 10% of referrers, and gave them Talent Scout status: early sight of open roles, quarterly sessions with the hiring leads, and a direct line to a recruiter instead of a form.
One senior engineer produced 11 referrals. Nine were hired. Eight were still with the company when I last checked the cohort.
Across the Talent Scout group, referral-to-hire conversion ran at 82% against a 31% company average, and we avoided roughly ₹40 lakh in agency fees in a single year. Democratic programmes underperform. Power-user activation works.
The transferable point is not about referrals. It is the standard: a non-wage reward with a named population, a tracked conversion rate, and a cost avoided that you can put in front of Finance. Hold every line in your benefits package to that standard and most of them will fail it, which is the finding.
The old way
- Quote the national average
- Multiply it by headcount
- Present the number
- Defend the budget on sentiment
The Lab Way
- Apply the sector ratio to your own wage base
- Subtract the statutory floor
- Subtract committed insurance at current design
- Defend the remainder on utilisation, line by line
Know that remainder to the nearest percentage point and something useful happens. Every new benefit request gets answered in the same conversation it is raised in, rather than disappearing into a two-week exercise with Finance that nobody ever schedules.
Are Employee Benefits Taxable? Pre-tax vs. Post-tax, Explained
Some employee benefits are taxable and some are not. The distinction is whether the tax code specifically excludes that benefit from gross income. Employer-paid health premiums, qualified retirement contributions, and HSA or FSA contributions within limits are generally excluded. Most other fringe benefits are taxable to the employee unless a specific exclusion applies.
That last sentence carries the whole section. The default is taxable, and the exclusions are the exception.
Most people assume the reverse, because the biggest benefits happen to be excluded. Health insurance and retirement contributions are so dominant in the average package that the exclusion feels like the rule, and the surprise arrives with the smaller items.
Here’s the rule underneath both:
| Benefit | Typical tax treatment | What to verify |
|---|---|---|
| Employer-paid health insurance premiums | Generally excluded from the employee’s gross income | Plan eligibility and dependent definitions |
| Qualified retirement plan contributions | Generally excluded, subject to annual limits | Current-year contribution and compensation limits |
| HSA and FSA contributions | Generally excluded within statutory limits | Current-year limits and eligibility rules |
| Educational assistance | Excluded up to a statutory cap when the programme qualifies | The cap and the programme’s qualifying conditions |
| De minimis fringe benefits | Generally excluded when genuinely minimal and infrequent | Whether the item meets the de minimis test at all |
| Group term life above the statutory threshold | Taxable as imputed income on the excess | The threshold and the imputed income calculation |
| Gift cards and cash equivalents | Taxable regardless of amount | Nothing. This one has no small-value exception |
| Personal use of a company vehicle | Taxable as imputed income on the personal-use portion | The valuation method and substantiation records |
| Wellness incentives paid in cash or cash equivalent | Generally taxable | Whether the incentive is cash-equivalent in form |
Every threshold and exclusion above should be checked against current IRS fringe benefit guidance before you act on it. This is general information for benefits design, not tax advice, and the amounts change annually. If you are formalising it, handle it as part of your wider policy formulation work rather than a payroll footnote.
⚠ WATCH OUT
Watch out: gift cards and cash equivalents are taxable regardless of value. A $25 voucher for a peer recognition win is taxable income, and so is the $10 one.
This is the single most common mistake in recognition programmes. I have watched a well-designed, genuinely popular recognition scheme turn into a payroll problem in December because nobody asked the tax question in March.
The operational fix is small and it works. Every new benefit gets a tax question at the design stage, in the same meeting where the budget is set, rather than at year end when payroll finds it.
Why the US benefits system looks the way it does
The structure you are working inside is about 80 years old, and it was not designed. It accumulated.
Wartime wage controls in the 1940s capped what employers could pay in cash, so they competed on everything that was not cash. Health coverage was the most attractive of those things, and the tax exclusion for employer-sponsored health insurance made the arrangement permanent rather than temporary.
ERISA arrived in 1974 and built a governance layer on top of a system that had grown for three decades without one. That sequence explains a great deal: why health insurance is bundled with employment in the US and nowhere else, why the tax exclusion is the largest single subsidy in the whole structure, and why any attempt to restructure benefits runs into design decisions nobody alive made deliberately.
You are not designing a package from first principles. You are editing an inherited one.
That is not a counsel of despair. It is a filter. Knowing which parts of your package are historical accident and which are deliberate design tells you which parts are genuinely open to change, which is exactly what the build blueprint further down assumes you already know.
The Utilisation Gap: Why most benefits budgets are half-wasted

Pull your last annual benefits review and look at what it reports. It will be a list of what is offered, what each line cost, and how that compares to market.
Now look for what it does not report. Consumption.
A benefit with 4% uptake and a benefit with 70% uptake appear identically in that document. Both are present, both have a cost against them, and nothing in the report distinguishes the one that is working from the one that is decorative.
That is a reporting failure with a price tag, and the evidence that the gap is real at scale is now unambiguous. Fewer than 35% of employees report high levels of overall wellness, despite sustained organisational investment in wellbeing programmes, across a wellness survey of 11,838 employees in the first quarter of 2026.
35%
Fewer than 35% of employees report high levels of overall wellness, despite sustained organisational investment in wellbeing programmes.
Source: Gartner, Employee Total Rewards Preferences Survey, 2026
Translation: two-thirds of the workforce is not getting the outcome the wellbeing budget was funded to produce. The same research, across 10,055 employees surveyed in May 2026, finds total rewards preferences have moved toward financial stability and security, ahead of work-life balance and career growth, and recommends removing under-utilised wellness benefits and redirecting that investment toward what employees value.
Note the shape of that recommendation. It is subtraction and redirection, not addition. Nobody in that dataset needed a longer list.
The old way
- Report what we offer
- Report what it cost
- Compare it to market
- Add what is missing
- Repeat at renewal
The Lab Way
- Report uptake per line item
- Report uptake by workforce segment
- Name the outcome each line was funded to move
- Subtract before considering additions
- Review quarterly, decide annually
Here is the reframe this article turns on. A benefits package is not a list of offerings. It is a portfolio of line items, each with a utilisation rate, and any line you cannot report a utilisation rate for is not a benefit. It is an assumption.
You are not over-spending on benefits. You are spending accurately on the wrong ones.
I have held the same position about pay for years, and it is the same error one layer out. Retention problems are overwhelmingly systems failures rather than compensation failures, and adding a benefit to fix a systems failure is the most expensive way available to not solve it.
You inflate fixed cost, create internal inequity, and lose the person anyway once the novelty wears off. That pattern is worth understanding properly alongside your employee engagement data, because the two questions are usually the same question.
How to execute:
1
List every line item with its cost and funding source
One row per line item, with annual cost and whether it is employer-paid, cost-shared, or employee-paid. Include the fourth bucket, item by item. This list is usually longer than anyone expects, and building it is the first useful thing the audit produces.
2
Pull uptake from the system that administers it
Carrier enrolment data, plan administrator reports, payroll deduction records, vendor dashboards. Where no uptake data exists at all, write that down rather than skipping the row. An absence of data is itself a finding, and usually the most expensive one on the sheet.
3
Express uptake against the eligible population
Not against total headcount. Eligibility rules distort the denominator badly, and a benefit restricted to one grade or one location will look like a failure when it is nothing of the sort.
4
Segment uptake by tenure, level, and location
A benefit at 12% overall might be at 60% inside the segment it was designed for, which is a success. Or it might be at 12% everywhere, which is not. Only the segmented view tells you which of those two you are looking at.
5
Name the outcome each line was funded to move
Write it down for every line item, then write down whether you have any signal on it. For most organisations this column comes back mostly blank. That blank column is the actual finding, and it is what the rest of this article is built to fix.
⚠ WATCH OUT
Common mistake: using total headcount as the denominator instead of the eligible population. It makes well-targeted benefits look like failures and pushes you toward cutting the wrong lines.
One note on method before the audit runs. Do not substitute a survey for it, because stated preference and revealed preference diverge, and only one of them costs money. Audit what was used, then survey to explain the gaps, which is the discipline behind every set of HR metrics that matter.
The instrumentation point is one I learned running high-volume programmes. Real-time tracker dashboards and daily stand-ups were what made a 420-hire campaign controllable, and the principle transfers exactly: you cannot manage a portfolio you only look at once a year.
Why “communicate it better” is not the fix
Every article that notices low awareness prescribes better communication. Communication does close part of the gap, and awareness of disability cover and EAP access genuinely is a communication problem.
But low uptake has three causes, and only one of them is communication. Awareness: the employee does not know the benefit exists, and communication fixes it. Relevance: the employee knows and it does not apply to them, and communication makes this worse by advertising the mismatch. Friction: the employee knows, wants it, and the claim process or eligibility rule defeats them, and communication is simply beside the point.
There is a fast way to tell which one is operating. Ask the segment with the highest uptake what they did to get it, then ask the lowest-uptake segment the same question.
◆ PRO TIP
Real talk: if the low-uptake segment already knows about the benefit, more communication is money spent confirming a mismatch. Three campaigns that move nothing is not a communication problem you have failed to solve. It is a diagnosis you have not made.
Run that audit and you will find things you would rather not have found. That is the point, and it is also the moment most benefits functions stop.
If you want the next framework before it goes public, the Lab Note is where these get published first. Subscribe and you will get the audit templates, the segmentation models, and the subtraction sequences as they are built, ahead of the blog.
How to Build an Employee Benefits Package: A 7-step Blueprint
Most guidance on this question offers three unmechanised instructions: review what competitors offer, communicate clearly, be flexible. None of those is a step. They are intentions with no method attached.
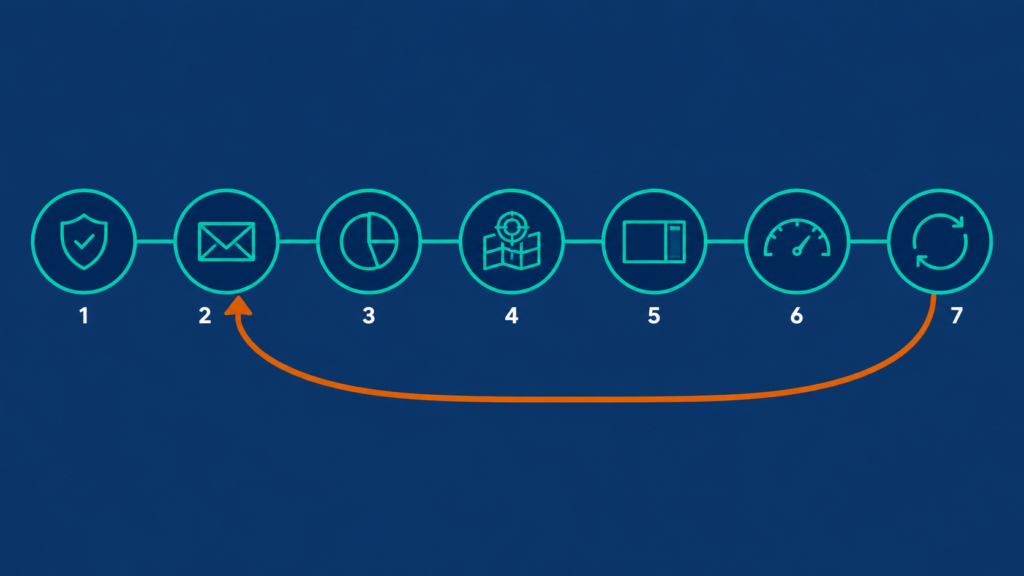
Here’s how to build it:
1
Step 1: Establish the legal floor
The first move is not design. It is compliance. Run the statutory checklist from the requirements section above against your actual headcount, entity structure, and state footprint, and identify the thresholds you are close to crossing.
Output: a one-page compliance baseline. This comes first because every benefit above the floor is a choice you have to justify, and you cannot identify the choices until you have separated them from the obligations.
2
Step 2: Set the budget envelope
Run the five-move method from the cost section and write down three numbers: the statutory floor, the committed insurance cost, and the discretionary envelope, each as an absolute figure and as a percentage of total compensation.
Output: three numbers on one line. This is the same discipline as mapping weekly hiring targets backward from a business start date rather than hiring optimistically and meeting the constraint late. Design before you have the envelope and you produce a package Finance trims, rather than one HR shaped.
3
Step 3: Segment the workforce
Split the population into the three to five segments that genuinely differ in what they need. Use life stage rather than age, work pattern, and compensation band, since the value of a tax-advantaged benefit varies sharply with income.
Output: a segment map with headcount against each. A universal package spreads the envelope evenly across a population with uneven needs, and that is precisely how a benefit ends up at 12% uptake and full cost.
4
Step 4: Benchmark the market you compete in
Benchmark against the organisations you lose candidates to, not against a national survey average. Take your last two quarters of declined offers and regrettable attrition, list the destination employers, and compare their published packages line by line for the roles you compete on.
Output: a comparison grid covering your top five talent competitors on the five benefits your segments care about most. A national average tells you what employers do. Your competitor set tells you what your candidates are choosing between.
◆ FROM THE LAB
Real implementation: we needed to scale an automation engineering team in a market where the qualified population was small and every competitor was hunting the same names. The reflex would have been to write the job description, post it, and wait.
Instead we ran an Intelligence-Led Sourcing exercise first, mapping 12 companies across the industrial IoT space. Team structures, reporting lines, who sat where, and which of them were hiring against the same skill profile we needed.
By the time the job description existed, we had 37 qualified candidates pre-identified. Time-to-Offer fell from 68 days to 34, which halved the cycle on the roles the business was waiting on.
Here is the part that transfers to benefits, and I did not appreciate it at the time. That same 12-company map told us what those employers were offering, not just where their people sat. Leave policy, flexibility norms, retirement design, and what candidates cited when they turned us down. No benefits benchmarking survey could have produced that, because it was drawn from the exact competitor set we were losing to.
Run that exercise once and it serves two functions at no extra cost. It is talent mapping for the recruiting team and competitor analysis for the benefits design, from a single piece of fieldwork.
5
Step 5: Design the core, then the flex layer
Allocate the envelope in two tranches. The core takes the majority and contains only benefits with genuinely universal relevance: health coverage, retirement, leave, and catastrophic protection. The flex layer carries everything that is life-stage or preference dependent.
Output: a two-tranche allocation with a stated split. This is the mechanism that lets you serve segmented needs without multiplying fixed cost, and it is what makes Step 7 possible, because a flex layer can be re-pointed annually without withdrawing anything from anyone.
The old way
- Add every requested benefit universally
- Keep adding until the budget runs out
- Define fairness as sameness
- Discover the cost at renewal
The Lab Way
- Keep the universal core deliberately narrow
- Fund one employee-directed flex allocation
- Define fairness as equivalent value
- Forecast the per-head cost before launch
6
Step 6: Instrument it before launch
Before anything goes live, define five things per line item: the uptake metric, where the data will come from, the eligible population forming the denominator, the segment cuts you will report on, and the outcome signal the benefit was funded to move.
Output: a one-page measurement plan that exists before launch rather than after. Retrofitting measurement onto a live benefit is how you end up with the blank column in the audit, and if you cannot name the data source at design time, you have designed a benefit you will never be able to defend. Build it alongside your other HR metrics rather than as a separate exercise.
◆ FROM THE LAB
My experience: the hardest programme I have run was 350 to 500 hires across customer support, operations analysts, junior engineers, and sales support, inside an 8 to 12 week window. Limited interviewer capacity, high candidate drop-off risk, and an immovable business start date.
We built the instrumentation into the design rather than adding it when things started slipping. Real-time tracker dashboards, daily recruiter stand-ups, weekly war-room calls with hiring managers, SLA-based vendor tracking on submissions and shortlist ratios, and a single point of contact per candidate batch.
Those dashboards were not reporting. They were the control mechanism. When a channel underperformed in week three we knew in week three, not at the post-mortem, and we re-pointed sourcing effort inside 48 hours.
The result: 420 hires in 10 weeks, Turnaround Time (TAT) down from 32 days to 18 to 20, a 90%-plus offer-to-join ratio, 85% to 88% retention at 90 days, and recruiter productivity up around 35%.
A benefits package with no equivalent instrumentation is being run open-loop. You will find out it did not work at the end of the year, when the only lever left is the renewal negotiation.
7
Step 7: Set a review cadence and hold it
Fix two cadences and put them in the calendar. Quarterly: a light, data-only utilisation review of the flex layer, with no decisions permitted beyond re-pointing the flex allocation. Annually, before renewal: the full audit, feeding a subtract-then-add decision rather than an add-only one.
Output: two recurring meetings with defined inputs and defined decision rights. This is the step that fails, because every organisation intends to review benefits and then reviews them at renewal, under time pressure. A cadence you hold when nothing is wrong is the only one that ever produces subtraction.
⚠ WATCH OUT
Watch out: a review held only at renewal, with the broker in the room, is a negotiation. It is not a review.
The agenda is set by the renewal, the options are set by the market, and subtraction is never on the table. Hold the quarterly one and the annual review changes character entirely, because you arrive with a year of data instead of a year of impressions. What you do with that data is the removal sequence further down.
What Benefits Do To Offer Acceptance and Retention
Everyone writing about this topic asserts that benefits drive recruitment and retention, and supports it with a vendor survey saying some percentage of candidates consider benefits important. Stated importance in a survey is not revealed preference at an offer.
Here is the narrow, defensible version instead.
Here’s the difference:
At the offer stage, benefits do exactly two things. They act as a qualifying filter, where a package below the market floor removes you from consideration before a conversation happens. And they act as a tie-breaker between two offers a candidate genuinely rates as comparable.
What they do not do is win a candidate who prefers the other role. No benefits package has ever rescued a job the candidate did not want.
◆ FROM THE LAB
The Sofia lens: my high-water mark on offer acceptance is 90%. In the bulk campaign described earlier, offer-to-join ran above 90% across more than 400 hires.
The package was not what produced that. The package was the qualifying condition, and it had to be at market or we would not have been in the conversation at all. What moved the number was accelerated offer releases and structured pre-joining engagement, both designed specifically to close the window where candidates drop out.
That is a more useful claim than “benefits win candidates”, and it points at a cheaper lever. The package was the entry ticket. The process was the differentiator.
If your offer acceptance rate is falling, decompose the declines before you touch the compensation bands. Separate pay declines from package declines from role declines, because most organisations record “compensation” for all three and then fix the wrong one.
One segment effect is worth knowing. Benefits weigh most heavily at the offer stage for candidates with dependants, ongoing health needs, or a pending life event, and that is precisely the group least likely to say so explicitly in a decline conversation. They will tell you it was the salary, and the candidate experience data will never contradict them.
The retention claim, honestly

This is the paragraph that argues against your instinct, so let me state it plainly. Benefits do not fix retention.
Pay matters up to a threshold, and beyond that threshold attrition is driven by unclear career paths, weak manager capability, missing role clarity, burnout produced by the operating model, and no visible way to move internally. Every one of those is a systems failure.
Adding a benefit to a systems failure inflates fixed cost without touching the cause, creates internal inequity, and loses the person anyway once the novelty passes.
What benefits do contribute is real, and it is narrow. They remove a specific class of exit reason: the person who left because they could not get parental leave, or could not afford the health plan, or could not access mental health support when they needed it.
That is a genuine contribution. It is also a much smaller claim than the one most benefits decks make.
The old way
- Attrition rises
- Log every decline as “compensation”
- Add a benefit
- Announce it widely
- Watch attrition continue
The Lab Way
- Decompose declines into pay, package, and role
- Read exit data for the actual cause
- Fund a benefit only when it addresses that cause
- Fix manager capability and mobility first
- Measure at 12 months against a matched cohort
◆ FROM THE LAB
My experience: my best 12-month cohort retention figure is 89%, and no benefit line produced it. The levers that worked were structural, not financial.
The First Look policy is the clearest case. A 48-hour internal window drove 23% of hires from internal moves and cut Time-to-Productivity from 67 days to 28, and it cost nothing to fund. What it cost was managerial discipline, which is a different currency and a harder one to find.
But here is the catch:
Before you fund a benefit for retention reasons, open your exit interview data and ask one question. Did anyone leave for the reason this benefit addresses?
If the answer is no, you are buying a solution to a problem you do not have, and the real one is still running. Put the money into manager capability, internal mobility, and the systems that make it easy to perform and progress instead.
Segmenting Benefits Across a Multigenerational Workforce
Somebody has handed you a generational persona deck. Gen Z wants flexibility, Millennials want purpose, Gen X wants stability, Boomers want retirement planning.
It will not survive contact with your actual population, and it is the least evidenced material in this entire subject area.
Here’s what predicts it:
Five variables do the work: dependants, health status, housing situation, income band, and proximity to retirement. None of them maps cleanly onto a birth decade.
A 45-year-old with a new baby and a 28-year-old with a new baby want the same thing. Their generational labels predict nothing useful, and designing around those labels sends childcare support to one of them and not the other for no defensible reason.
Build four or five working segments on those variables instead, sized with headcount from your workforce planning data. Early career with no dependants, established with young dependants, mid-career carrying responsibilities in both directions, and late career approaching retirement is a reasonable starting cut. Adjust it to fit your population rather than importing someone else’s.
The market evidence supports the life-stage frame directly. The preference shift toward financial stability and security shows up across the workforce rather than inside one cohort, which is exactly what a life-stage model predicts and a generational model misses.
◆ FROM THE LAB
The Sofia lens: I have run the equivalent exercise on the sourcing side, and the lesson was the same one. When we set out to improve pipeline diversity, the thing that worked was not a broad campaign aimed at the whole population.
It was identifying the specific channels and communities where the talent we were missing was, then going there deliberately through partnerships with diverse job boards, targeted referral drives, and inclusive campus outreach. Diverse slate ratios rose at interview stage and conversion to offer improved, with no cost to Quality of Hire.
The transferable point for benefits design: segmentation works when you segment on the variable that predicts the outcome. It fails when you segment on a proxy, and a birth decade is a proxy.
⚠ WATCH OUT
Watch out: design segmentation and administrative differentiation are different things, and conflating them creates real legal exposure.
Segmenting to understand needs, size a budget, and shape an offering is legitimate design work. Differentiating an individual employee’s benefit treatment on a basis that touches a protected characteristic is not. The design cut informs what you build. It never becomes the administrative rule.
The implementation:
The flex layer from Step 5 is how segmentation gets delivered without building four separate benefits programmes. It takes three common forms, and they behave differently.
| Form | Employer cost | Administration required | Effect on perceived value |
|---|---|---|---|
| Lifestyle Spending Account | Fixed per head, fully forecastable | Moderate: a category list, a claims mechanism, and a tax review per category | Highest, because the employee chooses where it goes |
| Benefits credit allocated at enrolment | Fixed per head, spent across a defined menu | Higher: menu pricing, enrolment logic, and annual re-pricing | High, though constrained by the menu you offer |
| Core plus buy-up | Low, since the employee funds the upgrade | Lower: carrier-side tiering rather than a new mechanism | Moderate, and it reads as access rather than as a gift |
One design rule holds all three together. The flex allocation should be equal in value across segments even though it gets spent completely differently, because equal value spent differently is defensible internally and unequal value never is.
Fund it by subtraction rather than by new spend. Gartner’s recommendation is specifically to redirect from under-utilised wellness programmes into Lifestyle Spending Accounts, which makes this a reallocation you can take to Finance rather than a request.
How to Cut a Benefit Without Triggering An Engagement Crash
You already know which three line items are dead weight. You will not touch them, because the last quiet removal produced two months of noise and nobody wants to repeat it.
Subtraction is the actual job in a cost-constrained year, and it is the one thing no guide on this topic will teach you. Here is the sequence:
1
Confirm the utilisation finding twice
Use two independent data sources, not one report read twice. Removing a benefit on bad data is unrecoverable, because you cannot reinstate it without admitting the analysis was wrong.
2
Identify exactly who uses it
The small high-uptake segment is the group that will experience this removal, and they are usually not the group that complains loudest. Know their headcount and what they will lose before you decide anything.
3
Prefer re-pointing to removing
Move the budget into the flex layer rather than deleting it. A redirected budget reads as a change. A withdrawn budget reads as a cut, and the two produce completely different reactions to an identical financial decision.
4
Sequence the announcement
The addition lands before or alongside the subtraction. Never after. Announce a removal first and whatever you add later reads as an apology rather than a plan.
5
Give the affected segment a transition
A notice period, grandfathering, or a one-time credit, proportionate to how much they relied on it. Somebody who built a care arrangement around a benefit needs more than a month, and giving it to them costs a fraction of what the alternative costs you.
6
Report the redirection publicly
Say it at the next all-hands, with the numbers. An unexplained subtraction becomes a rumour. An explained one becomes evidence that somebody is managing the package, which is a reputational asset most benefits functions never build.

The communication structure is not optional decoration around the decision. I learned that running programs where weekly war-room calls and a single point of contact per group existed precisely because a change program without a communication structure generates its own resistance, and change management discipline applies identically here.
◆ PRO TIP
The honest downside: some removals will cost you goodwill regardless of how well you handle them. There is no version of this where everybody is pleased.
The ones handled worst are the ones handled quietly. A benefit that disappears from the enrolment pack with no explanation costs more trust than one removed openly with a reason and a replacement.
What is Changing In Employee Benefits in 2026
Four developments this year carry a budget consequence. Everything else is commentary.
The preference shift toward financial stability:
Employees now prioritise financial stability and security ahead of work-life balance and career growth, and value future base pay increases and long-term incentive design over short-term incentives and merit differentiation. The budget consequence: the retirement and equity block is gaining weight relative to the flexibility block, and a package built on the 2021 assumption that flexibility carries everything is now mispriced.
GLP-1 coverage becoming a budget line:
23% of employers now offer coverage for GLP-1 drugs for type 2 diabetes, weight management, or both. The budget consequence: this needs a coverage policy with criteria, step therapy, utilisation management, and a stated ceiling. A yes or no decision is not a policy, and the difference between the two is measured in millions at scale.
AI tool access appearing as a benefit:
16% of employers now provide employees with access to AI chatbot subscriptions such as ChatGPT, Copilot, or Claude. The budget consequence: low cost, high visibility, currently a differentiator, and table stakes within about two years.
Quiet contraction in heavy accounts and family-care leave:
Medical FSAs are down to 60% of employers from 68% in 2021, dependent care FSAs to 54% from 65%, paid leave for immediate family care to 31% from 33%, and extended family care to 17% from 19%. The budget consequence: the market is already subtracting. The only question is whether yours is doing it deliberately or by drift.
Source: SHRM, 2025 Employee Benefits Survey Executive Summary and Gartner, Employee Total Rewards Preferences Survey, 2026
◆ PRO TIP
Pro tip: on the AI subscriptions, my position on AI in HR applies without modification. It is a co-pilot, not a decision-maker, and it accelerates thinking while the human owns judgment, context, and the final call.
Fund the capability-building alongside the licence or do not fund it at all. A subscription nobody knows how to use is the utilisation gap in miniature, purchased deliberately.
Frequently Asked Questions
What are the 4 major types of employee benefits?
The four major types are insurance, retirement plans, paid time off, and additional or fringe benefits. The first three are near-universal in US packages. The fourth is a residual category absorbing everything else, from tuition support to wellness stipends, which is why it is where budget accumulates unexamined.
How much do employee benefits cost per employee?
Benefits averaged 31.6% of total compensation for civilian workers and 30.1% for private industry workers in March 2026, per BLS. The useful figure is not the national average. It is your own wage base, converted using the sector ratio, minus your statutory floor.
Which employee benefits are legally required in the US?
Employers must fund Social Security and Medicare contributions, unemployment insurance, and workers’ compensation. Covered employers must also provide FMLA leave, COBRA continuation coverage, and ACA-compliant health coverage if they are an Applicable Large Employer. State mandates add paid sick leave, paid family leave, and retirement auto-enrolment in a growing number of states. Verify current thresholds before acting.
Are employee benefits taxable?
Some are. Employer-paid health premiums, qualified retirement contributions, and HSA or FSA contributions within limits are generally excluded from taxable income. Most other fringe benefits are taxable unless the tax code specifically excludes them, and that includes gift cards and cash equivalents regardless of value.
What benefits do employees value most in 2026?
Health coverage remains the anchor, but Gartner’s 2026 research finds preferences have shifted toward financial stability and security, ahead of work-life balance and career growth. Medical benefits protecting against unexpected costs rank highest, followed by fund-based benefits across core medical, life, dental, and vision, then family benefits.
The organisations with the best benefits are not the ones spending the most
I spent years watching benefits budgets get approved without anybody in the room being able to say what the last one produced. I sat in those meetings. For a long time I did not ask the question either, because the package was at market and the market was the benchmark everyone accepted.
The results were predictable. Spend rose every year. Engagement did not move. Nobody could name a single line item that had changed an outcome.
Here’s what changed everything:
Treating the package as an instrument instead of a menu. A defined budget envelope you have calculated. A design segmented by life stage, a utilisation signal against every line item, and a review cadence with the standing right to subtract.
What separates the organisations that do this from the ones that do not is not budget. It is the willingness to subtract, and subtraction requires the audit most benefits functions have never run.
This is not theoretical, and the macro numbers say so. Global employee engagement fell to 20% in 2025, down from a 23% peak in 2022 and 2023, the first time engagement has declined in two consecutive years. Thriving in overall wellbeing sits at 34%, up a single point. Gallup puts the cost of low engagement at roughly $10 trillion in lost productivity, about 9% of global GDP.
Source: Gallup, State of the Global Workplace 2026
Engagement fell while benefits spend held at roughly a third of total compensation. The money is being spent. The outcome is not arriving, and the gap between those two facts is what this entire article was about.
So do not rebuild the package. Pick three line items. One from your flex layer, one from the fourth bucket, and one you have never seen a utilisation number for.
Run the five-move audit on those three over the next 90 days. Express uptake against the eligible population, segment it, and write down the outcome each was funded to move. Then re-point what fails, announce the addition first, and report the redirection openly.
The Lab Note goes out with the frameworks behind this article, including the audit template and the segmentation model, before they appear on the blog. Subscribe if you want them early.
And if you run this audit in your own organisation, I want to hear what you find. The blank column is always bigger than people expect, and comparing notes on it is more useful than any benchmark. Connect with me on LinkedIn and tell me what your fourth bucket was hiding.
