


I have run Talent Acquisition at enterprise scale for eight years, 250-plus hires a year.
And I have sat in the monthly people review more times than I can count. Not once have I watched a decision change because of the numbers in it.
You know the meeting. The deck opens with headcount, moves to turnover, and lands on Time-to-Fill. The finance lead waits politely for the part that touches the budget, and it never arrives.
HR does not have a measurement problem. It has a translation problem.
Most HR functions measure plenty. Almost nothing they measure is denominated in a currency the business already uses to make decisions.
An unfilled senior engineering role drains around $500 a day in operational cost. A 60-day vacancy is roughly $30,000 of lost productivity, before anyone counts a recruiting dollar.
Most HR reports contain the 60. Almost none contain the $30,000.
31%
Of recruiting functions use labor market data to shape their business and talent strategies.
Source: Gartner HR Research, 2026
Translation: the data exists, the tooling exists, and the number still is not reaching the person who decides. That is a translation failure, not a collection failure.
Here’s what this guide gives you:
- The metric-to-dollar translation model, with the arithmetic written out
- The complete metric framework by function, each one with its formula, the decision it drives, and the distortion to watch for
- A seven-step build sequence you can start on Monday
- The three-tier reporting cadence that keeps weekly noise out of the board pack
- The legal limits of people measurement in the US, which nobody else in this category writes about
HR Insights Lab approach: every number in this guide came out of a live hiring operation or a sourced study, and each one carries the decision it is supposed to drive. Where I have no data, I say so and give you the argument instead.
What Is HR Metrics and Analytics?
HR metrics and analytics is the practice of measuring workforce activity and interpreting what those measurements mean for business outcomes. Metrics are the counts, rates, and ratios produced on a schedule. Analytics is the investigative work that explains why a number moved and what decision it should trigger.
Here’s the difference:
Your turnover rate is 18%. That is a metric. Establishing that the 18% is concentrated in one manager’s team, inside the first eleven months of tenure, is analytics.
Two words, two layers, two different jobs. Collapsing them into one phrase is how a function ends up owning a dashboard and no answers.
HR Metrics Defined — The Measurement Layer
The measurement layer answers one question: what is the number. hr metrics are judged on accuracy, consistency, and timeliness, and on nothing else.
The bar here is reproducibility. If the same query returns a different number next month and nobody can explain the gap, you do not have a measurement layer yet.
This layer is unglamorous and non-negotiable. Everything built on top of it inherits its errors.
HR Analytics Defined — The Explanation Layer
The explanation layer answers two questions: why is the number what it is, and what should we do about it. hr analytics is judged on one outcome only, which is whether a decision changed.
Intelligence-Led Sourcing is the shape this takes in my own work. Continuous market mapping runs before vacancies arise, so the interpretation is already in place when the requisition lands, built on the measurement layer instead of substituting for it.
Here is a test you can run on Monday. Pull your last HR report and mark every line as either a count or a conclusion.
Most reports come back 100% counts. That is a reporting function, and calling it an analytics function does not make it one.
The Old Way
- Buy a dashboard
- Declare the analytics problem solved
- Wonder why nobody acts on it
The Lab Way
- Audit your own report for the count-to-conclusion ratio
- Name the decision each conclusion is meant to change
- Spend on tooling only once you know which answers are missing
Why HR Metrics and Analytics Are Not Interchangeable
There is a structural reason the two words collapse into one. Most HR teams inherited their reporting from payroll and finance systems that were built to produce counts for compliance, not to answer questions.
The vocabulary followed the tooling. So when a CHRO asks for analytics and receives a headcount table, nobody in that exchange is lying.
Inside that organization the two words genuinely mean the same thing. Fixing the vocabulary is the precondition for fixing the function, and it costs nothing.
◆ PRO TIP
Lab Note: Get the two definitions agreed in writing before the first dashboard is scoped, and get HR, Finance, and IT to sign the same page. Three functions using one word for three different things will argue past each other for the entire implementation, and the argument surfaces as a tooling complaint rather than a vocabulary one. Ten minutes at the start saves a quarter of rework.
HR Metrics vs HR Analytics: The Difference That Changes Your Reporting
Five separate pages ranking for this comparison deliver two vague paragraphs each. You still cannot apply the distinction after reading them.
Here is the version you can screenshot and paste into your own team charter.
Here’s the difference:
| Dimension | HR Metrics | HR Analytics |
|---|---|---|
| Core question | What happened? | Why, and what next? |
| Output format | Counts, ratios, rates | Models, segments, drivers |
| Typical owner | HR operations, HRIS | People analytics, HR Business Partner |
| Cadence | Weekly or monthly, fixed | Triggered by a question |
| Skill required | Data hygiene, reporting discipline | Statistics, business context, storytelling |
| Failure mode | Numbers that do not reconcile | Conclusions the data cannot support |
| Success test | The number is right | The decision changed |
HR metrics report the state of the workforce. hr analytics explains that state and names the move. In Talent Supply Chain terms, metrics tell you the inventory level and analytics tells you whether the supply chain is about to break. One is judged on accuracy. The other is judged on whether anyone acted.
Which leaves the question the table does not answer. When does a metric earn an investigation?
◆ FROM THE LAB
The Sofia lens: I escalate a metric into an analytics question on two triggers. The first is a move of more than one standard deviation from its own trailing twelve-month baseline. The second is a move in the opposite direction to a metric it normally tracks with.
Three pairings sit at the top of my list. Offer acceptance climbing while Time-to-Offer climbs with it, which usually means we are winning the candidates nobody else wanted. Regretted attrition falling while internal mobility falls alongside it. Cost per hire dropping while ninety-day attrition rises, which finance spots before HR does.
I keep that trigger list written down and dated, the same way I schedule competitor and talent-landscape analysis instead of running it when somebody panics. Investigation becomes a rule, not a mood.
◆ PRO TIP
The catch: Teams either investigate nothing or investigate every wobble, and both waste the analytics function equally. Five written pairings is enough for most functions in year one. Add a sixth only when a real event proves you needed it.
The Four Types of HR Metrics and Analytics

Once the two layers are separate, the maturity question becomes answerable. Four levels, each demanding more data than the last.
The data precondition is the part every other guide leaves out. It is the only part that determines whether you can attempt a level at all.
1
Descriptive HR Metrics — What Happened
Descriptive HR metrics are the backward-looking count layer: headcount, turnover rate, Time-to-Fill, absence rate, and cost per hire. Roughly 80% of HR functions live here permanently, and there is no shame in that.
The quality bar is reproducibility. A descriptive metric earns its place only if the same query returns the same number next month.
Three worked calculations, so you can audit your own. Turnover rate is leavers in the period divided by average headcount in the period. Time-to-Fill is days from requisition approval to offer acceptance, and cost per hire is total internal and external recruiting cost divided by hires in the period.
The full catalogue by function sits further down, where the best hr metrics to track are broken out with formulas and failure modes.
2
Diagnostic HR Analytics — Why It Happened
Diagnostic HR analytics is segmentation and correlation work. You cut a metric by tenure, manager, location, function, hiring source, and pay band until the variance concentrates somewhere.
How to execute:
Start with the aggregate. Split on the dimension most likely to carry the signal, then split again inside whichever slice moved.
Here is what that produces. An overall 18% turnover rate that runs at 9% everywhere except one business unit at 41% is a management problem, not a compensation problem.
The aggregate hid it completely. A company-wide pay review would have spent the entire budget in the wrong place.
Pay matters up to a threshold. Past it, attrition runs on unclear career paths, weak manager capability, poor role design, and thin internal mobility. Segmentation is how you prove which one is operating before you fund a fix.
3
Predictive HR Analytics — What Will Happen
Predictive HR analytics models future state from historical pattern: flight risk, hiring demand forecasts, Time-to-Fill projections by skill, and offer acceptance likelihood.
A prediction is a probability attached to a population. It is never a verdict on an individual, and using it that way is an ethics failure and an exposure at the same time.
Talent Market Pre-Alignment is predictive work pointed at supply instead of attrition. I identify and engage talent ahead of demand through targeted competitions, challenges, and talent pools, so capability, interest, and availability are pre-aligned before a requisition opens.
⚠ WATCH OUT
Watch out: Two preconditions gate this layer. You need at least twenty-four months of clean historical data, and enough events in the outcome class to model.
Buy the predictive module because the demo was impressive, skip both checks, and the failed pilot will discredit your entire function for two budget cycles. The honest limits get a full section of their own further down.
4
Prescriptive HR Analytics — What to Do About It
Prescriptive HR analytics recommends an intervention and estimates its effect. Shorten stage-two interview scheduling by four days, and projected offer acceptance moves from 74% to around 81%.
Almost no HR function reaches this layer honestly. The recommendation requires a causal claim, and most HR data is observational.
Here is the substitute I use. Run the change on one business unit, hold a comparable unit as the control, and measure the gap. That is prescriptive enough to act on and defensible in front of a CFO.
I have run that pattern three times on sourcing method. Structured competitor analysis lifted Quality of Hire by 12%. Talent landscape mapping across similar industries lifted it by 14%, and a skills-based talent pipeline built after market analysis lifted it by 30%.
One change each time. Tested, then measured.
◆ PRO TIP
The honest downside: None of those three numbers is a controlled experiment in the academic sense, and I would not present them as one. They are before-and-after results with the method named and the comparison unit held, which is the standard every other function in the business is already held to.
Most HR teams should not attempt the prescriptive layer yet. Saying so out loud is not an admission of failure, and treating the fourth level as a maturity badge is how functions skip the three that would have worked.
Why Most HR Metrics and Analytics Never Change a Decision
Four levels, each harder than the last. And the level is rarely the reason HR measurement fails.
Functions that cannot influence a decision are not under-measuring. They are measuring things that were never wired to a decision in the first place.
Three mechanisms produce that outcome. Only one of them gets written about.
The Vanity Metric Problem in HR Reporting
A vanity metric is a number that reliably moves and cannot be tied to an action anyone will take. Total applications received is the purest example in HR.
It goes up. It looks like progress. No one has ever changed a hiring decision because of it.
More applications never meant better hiring. Five hundred wrong candidates cost you screening hours you never get back, and they bury the handful of people you should have called.
The right five candidates beat five hundred wrong ones.
Here is the swap. Every metric on the left reliably moves and decides nothing, and shifting your hr reporting to the column on the right takes an afternoon.
The Old Way
- Total applications received
- Careers-page traffic
- Referral program participation rate
- Training hours delivered
- Survey response rate, unsegmented
The Lab Way
- Qualified-applicant rate per channel
- Application completion rate
- Referral conversion by referrer
- Capability change at ninety days
- Engagement variance by manager
The third row is the one that cost me the most to learn.
◆ FROM THE LAB
My experience: Our referral program looked healthy for two years. Participation rate sat where the benchmark said it should, submissions arrived every month, and nobody questioned it.
Then I measured conversion by referrer instead of participation across the population. Between 5 and 10% of employees were generating the overwhelming majority of successful hires. Everyone else was forwarding job links into their network and producing nothing.
One senior engineer accounted for 11 referrals. Nine were hired. Eight were still with the company when I last checked that cohort, and his conversion rate ran at 82% against a company average of 31%.
So we stopped running the program democratically. The top referrers got Talent Scout status, early sight of open roles, quarterly sessions with hiring managers, and perks that signaled the company knew exactly who they were. The broad participation campaigns stopped.
Across that cycle the shift avoided approximately $48,000 in agency fees, on roles that would otherwise have gone to a search firm at 18 to 22% of total compensation.
The transferable part is not the perks. Participation rate and conversion by referrer are the same program measured two ways, and only one of them told me where the hires were coming from.
Definitional Drift — When HR Metrics Stop Reconciling
This is the failure nobody in this category writes about, and it is the most damaging of the three. Definitional drift is the same metric name producing different numbers because the underlying definition was never written down.
Here are the ambiguities that produce it. Does headcount include contingent workers, interns, employees on unpaid leave, and people who have resigned but not yet left?
Does turnover use average headcount or period-end headcount as the denominator? Does Time-to-Fill start at requisition approval or at requisition raise? Is an internal transfer a termination plus a hire, or neither?
None of those has a universally correct answer. Each has a correct answer for your organization, written down once and defended.
⚠ WATCH OUT
Common mistake: HR reports 14% turnover. Finance reports 19%. Both numbers are defensible, both were computed honestly, and the board now trusts neither one.
The damage is not the wrong conclusion. It is two credible numbers disagreeing in front of the executive team, and that is a credibility loss you do not recover inside one quarter.
The fix is a one-page metric dictionary. Every entry in your hr metrics dictionary carries six fields, and the sixth is the one teams skip.
- The formula, with numerator and denominator named explicitly
- The source system and the specific field the number comes from
- Inclusion rules, written as a list of who counts
- Exclusion rules, written as a list of who does not
- A named owner, by person and not by team
- The date the definition last changed
Make the dictionary the tiebreaker in any dispute. Two functions arguing about a number resolve it by reading, which takes four minutes instead of four meetings.
Definitions that were never written down cannot survive a three-year comparison. Which is part of why HR planning horizons stay so short: McKinsey’s HR Monitor 2025 found that only 12 percent of HR leaders say they do strategic workforce planning with at least a three-year focus.
Source: McKinsey & Company, HR Monitor 2025
Translation: the planning horizon collapses to the period over which the numbers still reconcile. Write the definitions down and the horizon extends on its own.
The Cadence Gap in HR Reporting
The third failure is correct metrics delivered on the wrong rhythm to the wrong audience. A weekly requisition-aging report is operationally useful and boardroom-useless.
An annual engagement score is boardroom-familiar and operationally useless. The symptom is the monthly HR pack that contains both, undifferentiated, and that nobody reads to the end.
Cadence should match the decision cycle of the audience, not the refresh rate of the system.
Why this works:
During high-volume campaigns I ran daily recruiter stand-ups against a real-time tracker, and weekly hiring war-rooms with the hiring managers. Same program, same underlying data, two separate rhythms.
The recruiters were deciding what to unblock today. The managers were deciding where to spend interview capacity this week, and a single merged report would have served neither decision.
Neither view was a report in the formal sense. Both produced a decision inside the interval they ran on, which is the only test a reporting layer has to pass.
The Gartner finding that only 31% of recruiting functions use labor market data to shape talent strategy belongs here too, because the constraint is not access to the number. The full cadence architecture is built further down, audience by audience.
The Complete HR Metrics and Analytics Framework by Function
Vanity metrics, drifting definitions, mismatched cadence. All three are fixable, and none of them tells you which numbers belong in the report to begin with.
So here is the working catalogue, organized by function. Each entry carries its formula, the decision it drives, and the distortion that makes it lie to you.
Recruitment and Talent Acquisition HR Metrics
Recruiters get measured on speed and cost, then blamed for quality. The three are never read as a set, which is the whole problem. Start your list of the best hr metrics to track here.
| Metric | Formula | Decision it drives | Common distortion |
|---|---|---|---|
| Time-to-Fill | Days from requisition approval to offer acceptance | Whether recruiter capacity matches the hiring plan | Improves when you quietly stop opening the hard roles |
| Time-to-Offer | Days from first qualified slate to offer issued | Where the internal bottleneck sits | Hides every delay that happens before a slate exists |
| Cost per hire | Total internal and external cost divided by hires in period | Sourcing mix and agency reliance | Falls the moment you stop investing in sourcing quality |
| Offer acceptance rate | Offers accepted divided by offers issued | Compensation positioning and candidate experience | Rises when the team only makes safe offers |
| Source-of-hire Yield Ratio | Hires from a channel divided by candidates entering from it | Where the sourcing budget goes next quarter | Flattered by channels fed pre-qualified referrals |
| Qualified-candidate ratio per stage | Candidates advancing divided by candidates assessed | Which stage is filtering the wrong people out | Moves when interviewers change, not when quality does |
Read speed, cost, and twelve-month quality as one triad. Improve any one of them alone and you degrade the other two, which is why cost per hire is the single most dangerous number in a recruiting pack.
My own reference points, held over years against the same definitions: 36 days Turnaround Time (TAT) on engineering roles, 39 days on bulk and volume hiring, and a 90% offer acceptance high-water mark. Those are practitioner numbers from one operating context, not industry averages, and I would not want you setting a target from them.
◆ PRO TIP
The catch: Cost per hire read alone will reward you for the exact behavior that breaks your pipeline in eighteen months. Cut sourcing investment, lean harder on inbound, and the number drops beautifully while Quality of Hire quietly collapses behind it. Never put cost per hire on a slide without the twelve-month quality figure next to it.
Quality of Hire — The Hardest HR Metric to Get Right

Every executive asks for Quality of Hire. Almost no HR function can produce it defensibly, and most respond with a manager survey score and hope nobody probes.
Build it as a weighted composite instead. Four inputs, tracked by cohort and by hiring source, which is the only way the number tells you anything you can act on.
- Ninety-day manager satisfaction rating
- Twelve-month retention of the hiring cohort
- Time-to-Productivity against the role’s own benchmark
- Performance rating at the first full review cycle
Weight the four to match what your business rewards, then leave the weights alone for two years. Defining the composite is the point where hr metrics stop being counts and start being an argument.
The measure has to be cohort-based, never individual. And it can only be read twelve months in arrears, which is precisely why organizations abandon it in month four.
Use a labeled proxy for the gap. Ninety-day retention plus manager satisfaction, reported openly as a leading indicator, with the annual composite as the true measure.
Early attrition is large enough to carry real signal on its own. McKinsey’s HR Monitor 2025 found that 18 percent of new hires leave during their probationary period, which is what makes the ninety-day number a legitimate proxy and not a convenience.
Source: McKinsey & Company, HR Monitor 2025
◆ FROM THE LAB
The Sofia test: a composite is only worth building if it moves when you change something. Mine did, three times.
Structured competitor analysis lifted Quality of Hire by 12%. Talent landscape mapping across adjacent industries lifted it by 14%. A skills-based talent pipeline built on market analysis lifted it by 30%, and that cohort produced my best twelve-month retention figure at 89%.
If your Quality of Hire number has never moved, the problem is the measure, not the hiring.
Retention and Turnover HR Metrics
Voluntary against involuntary. Regretted against non-regretted. First-year and first-ninety-day attrition, internal mobility rate, and average tenure by function.
Only three of those belong in a leadership pack, and the aggregate turnover percentage is not one of them.
The Old Way
- Report one annual turnover percentage
- Compare it to a published industry benchmark
- Commission an engagement survey when it rises
The Lab Way
- Report regretted attrition, segmented by manager and tenure band
- Measure it against your own trailing baseline
- Cut by hiring source before you spend a dollar on a fix
Retention problems are mostly systems failures, not compensation failures. Unclear career paths, weak manager capability, poor role design, burnout from a bad operating model, and thin internal mobility do more damage than any pay gap, and segmentation is how you prove which of the five is running.
◆ PRO TIP
Real talk: Average headcount and period-end headcount produce materially different turnover rates in a growing organization, and the gap widens the faster you hire. Neither denominator is wrong. Picking one without documenting it is, because next year’s comparison silently becomes meaningless.
◆ FROM THE LAB
My experience: we were paying external market rates to hire people whose skills already existed two floors up. Nobody was hiding them. Our own process simply never looked inside before it looked outside.
So we put a First Look policy in place: a 48-hour internal posting window before any role reached an external channel. The window alone did very little. What changed the outcome was instructing recruiters to approach internal candidates directly during those 48 hours instead of waiting for applications to arrive.
Over that cycle, 23% of our hires became internal moves. Time-to-Productivity ran at 28 days for those internal hires against 67 days for external ones, roughly 40 to 50% faster to full contribution.
Here is the reporting lesson. Internal mobility rate is a retention metric and a speed metric at the same time, which is why it belongs in both halves of your pack. File it only under retention and the operations side of the business never sees the number that would have won the argument for them.
Engagement and Employee Experience HR Metrics
Engagement score, eNPS, participation rate, and manager-level engagement variance. The first three go in a deck and change nothing, year after year.
The aggregate engagement score is close to useless. The variance between managers is where the entire signal lives.
Why this works:
Report engagement as a distribution across managers, not as a company number. Flag the bottom and top deciles by name, then put each bottom-decile team’s turnover and internal mobility figures directly alongside the score.
The unit of action is one manager and one team. An org-wide two-point improvement target is not an action, and nobody has ever been held to it.
Gallup puts US engagement at 32% of employees engaged at work. Use it as an order-of-magnitude check, and notice that the national figure is itself an aggregate concealing exactly the manager-level variance this section is about.
Source: Gallup, State of the Global Workplace, United States country-level data, 2025
⚠ WATCH OUT
Watch out: A rising response rate with a flat score is routinely reported as stability. It usually means the skeptics started answering, which is a decline disguised as a plateau. Read response rate and score together or you will misread the year.
Performance and Productivity HR Metrics
Revenue per employee, performance rating distribution, goal completion rate, span of control, and Time-to-Productivity for new hires.
Most HR productivity metrics are proxies. Label them as proxies in the report and Finance will engage with them, because the argument you are having is no longer about whether the number means what you claimed.
| Metric | What it exposes | How to read it |
|---|---|---|
| Revenue per employee | Business leverage, not HR performance | Present as a business ratio HR influences, never as an HR score |
| Performance rating distribution | Whether the rating discriminates at all | Read against promotion rate and voluntary exit rate by rating band |
| Time-to-Productivity | Onboarding and role-design quality | Benchmark by role family and by internal against external hire |
| Span of control | Manager load, which drives engagement variance | Pair with the bottom-decile engagement teams |
The rating-band exit analysis is the one only HR can produce. If your top-rated people leave at the same rate as your middle band, the rating is not measuring anything the business values.
Time-to-Productivity earns its place because it has a defensible definition and an action attached. My own figures, 28 days for internal hires against 67 for external, made the internal mobility business case without a single slide of narrative.
◆ PRO TIP
The catch: Label a proxy as a proxy in the footnote of the slide it appears on. HR loses productivity arguments with Finance by presenting proxies as measures, and the credibility damage outlasts the meeting by about a year.
Learning and Development HR Metrics
Training completion rate, training cost per employee, internal fill rate for hard-to-replace roles, skill coverage against a defined skills matrix, and time-to-competency.
Training hours delivered and completion percentage are the clearest vanity metrics in the whole of HR. They measure attendance.
The Old Way
- Report training hours delivered
- Report completion percentage
- Watch the budget get cut first in a downturn
The Lab Way
- Report internal fill rate for hard-to-replace roles
- Report skill coverage against the matrix
- Keep everything else as operational detail
Internal fill rate is the only L&D number an executive will defend under pressure. It shows the investment produced capacity the business can deploy, which is a claim that survives a CFO’s questioning.
The same skills-matrix discipline works on the building side as well as the buying side. Constructing a skills-based talent pipeline off market analysis lifted my Quality of Hire by 30%, and the matrix that made it possible was the same artifact L&D needed for succession.
HR Operations, Cost and Efficiency HR Metrics
HR-to-employee ratio, cost of HR per employee, service ticket resolution time, payroll accuracy rate, and absence rate. This set exists to defend your own function.
It goes to a different audience on a different rhythm than workforce metrics. Mixing the two is how a workforce risk conversation turns into a conversation about your headcount.
How to execute:
Bring one line to the cost review: cost of HR per employee, trended over three years against headcount growth. A flat or falling ratio against rising headcount shows the function is scaling.
A rising ratio shows it is growing. Those are two completely different conversations, and the trend line has the first one for you before you open your mouth.
⚠ WATCH OUT
Common mistake: Treating the HR-to-employee ratio as a target to hit. It varies enormously by industry, operating model, and how much you outsource, so an imported benchmark tells you nothing about whether your function is the right size. Trend your own ratio and ignore everyone else’s.
Diversity and Representation HR Metrics
Representation by level, hiring-slate diversity ratio, offer and acceptance rates by group, promotion-rate parity, and pay-equity gap. All measured at group level, never used for an individual decision.
Treat these as funnel analytics with the same rigor as any other conversion measurement. Measure at every stage, because a diverse applicant pool with a non-diverse hire outcome localizes the problem to one specific stage.
An annual headline percentage tells you a gap exists. Stage-by-stage conversion tells you where it is made.
◆ FROM THE LAB
My experience: we ran a targeted initiative on the sourcing end rather than the selection end. Partnerships with diverse job boards, referral drives aimed at underrepresented groups, and inclusive campus outreach.
Representation rose in early and mid-stage pipeline roles. Diverse slate ratios improved at interview stage, and conversion to offer improved behind them.
Quality of Hire did not drop. That last clause is the one worth writing down, because the unspoken objection in every one of these programs is that the bar moved, and the funnel data is what answers it.
⚠ WATCH OUT
Red flag: Measuring selection rates by protected group carries direct legal implications in the US. Read the legal limits section further down before you design the analysis, and involve employment counsel on methodology before you run it.
How to Translate HR Metrics and Analytics Into Financial Language
You now have the catalogue. Every number in it is still denominated in days, percentages, and counts.
Your CFO funds dollars. Here is the arithmetic that gets you from one to the other, and it is the part no competing page on this topic will show you.
The Cost-of-Vacancy Model Behind Every Recruiting HR Metric

Here’s how to build it:
1
Take the role’s fully loaded annual cost and divide by working days. That gives you a daily cost of the person you do not have.
Apply a productivity multiplier for that role family, then add any quantifiable revenue or delivery impact the vacancy creates. The result is your cost of vacancy per day.
$500
Per day, per unfilled senior engineering role. A 60-day vacancy costs approximately $30,000 in lost productivity.
That $500 is the figure I use in my own business cases, drawn from one operating context. Compute yours, because the multiplier for a revenue-carrying role looks nothing like the multiplier for a back-office one.
Now the pivot. Once you hold a per-day figure, every day you cut from Time-to-Fill converts directly into dollars, and the moment that conversion exists your recruiting metric has become a finance metric. Naming that translation is the entire job of hr analytics at the executive table.
Converting Turnover HR Metrics Into Replacement Cost
Build replacement cost from components Finance can audit line by line. Four of them.
- Separation cost: exit processing, accrued leave payout, any severance
- Vacancy cost: your per-day figure multiplied by days open
- Recruiting cost: sourcing, agency, assessment, and interviewer time at loaded hourly rates
- Ramp cost: the productivity gap across Time-to-Productivity
Compute this once per job family and reuse it. Computing it per role is what stops teams from ever finishing, and a job-family figure is accurate enough to defend. That reuse instruction is what keeps hr reporting on replacement cost from becoming a permanent project.
⚠ WATCH OUT
Common mistake: Omitting ramp cost. It is usually the largest of the four components and the one most reliably left out, because it is the only one with no invoice attached to it.
Look at the size of the gap. In my own data, Time-to-Productivity ran at 28 days for internal hires and 67 days for external ones. Drop ramp cost from the model and you understate the true cost of an external replacement by more than a month of output.
Proving HR Analytics ROI Through Cost Per Hire

A business case needs five things: the baseline, the intervention, the new number, the time change, and the annualized saving across next year’s volume.
Here is mine, with every figure in US dollars.
| Senior engineering roles | Before | After |
|---|---|---|
| Cost per hire | $7,800 to $9,000 | $3,600 to $4,600 |
| Primary cost drivers | Agency fees, long cycle times | Direct sourcing, internal referrals |
| Time-to-Fill | 70 to 80 days | 45 to 50 days |
| Agency reliance | Default route | Down 60 to 70% |
The intervention was direct sourcing, internal referrals, and targeted talent pools. Agency fees on those roles ran at 18 to 22% of total compensation, roughly $9,500 to $12,000 per hire, and four of six senior roles closed without an agency at all.
Cost per hire fell 45 to 55%. Senior roles closed 20 to 30 days faster.
Now here is the part that gets the budget approved. Do not lead with the 45 to 55%.
Lead with roughly $4,000 saved per senior hire, multiplied by next year’s senior hiring plan. Forty roles makes that $160,000 released back to the business, weighed against the cost of the analytics work that found it. Percentages describe the past. Annualized dollars fund the future.
◆ FROM THE LAB
My experience: an automation engineering team needed to scale, and the conventional sequence would have been to wait for the requisitions and then start looking. We had watched that sequence produce 68-day Time-to-Offer figures on roles the business needed filled in half that.
So we mapped the talent before the demand existed. Twelve competitor organizations across the industrial IoT space, profiled for who held the capability, where they sat, and what would move them.
By the time the first job description was written, 37 qualified candidates were already identified. Time-to-Offer fell from 68 days to 34.
Here is how that becomes a finance argument. Thirty-four days saved on a role carrying a $500-per-day vacancy cost is roughly $17,000 of recovered productivity, per role, before you count the agency fee that never got paid.
I did not present that work as a sourcing improvement. I presented it as recovered productivity with the method attached, and it was funded in one meeting instead of three.
MID-POST CTA GOES HERE
How to Build an HR Metrics and Analytics System in Seven Steps
You have the catalogue and the translation model. Building the system that produces both, on a schedule, without a platform purchase, takes seven steps.
Each one is a single discrete action. Start Monday.
1
Step 1: Start With the Business Question, Not the HR Metric
Write down the five questions the business will ask this year, in the business’s own words. Can we staff the new plant on the current hiring plan? Why are we losing second-year engineers? Is our interview process filtering out the people we later wish we had hired?
Then work backwards to the minimum metric set that answers them. Intelligence-Led Sourcing runs the same way, starting from a forward question about capability demand instead of from an open requisition.
The discipline: if a metric does not appear in the answer to a written question, it does not go in the report.
2
Step 2: Lock Your HR Metrics Definitions in Writing
Build the metric dictionary. Each entry in your hr metrics dictionary carries nine fields: name, plain-language description, formula with named numerator and denominator, source system, specific source field, inclusion rules, exclusion rules, refresh frequency, and named owner. The tenth line is the date the definition last changed.
Governance rule: a definition change needs the owner’s sign-off and gets annotated on every chart crossing the change date.
An unannotated definition change looks exactly like a real trend. Someone will present it as one.
3
Step 3: Fix the Source Data Behind Your HR Metrics
Run five reconciliations before the first report ships, then monthly.
- HRIS headcount reconciles to payroll headcount, with every difference explained
- Every employee has a valid manager and a valid cost center
- Termination reasons are coded consistently and “other” sits below a threshold you set
- Requisition dates are captured at approval, never backfilled
- Job architecture is mapped so “Engineer II” means one thing across business units
Publish the exception count as a metric in its own right. The real-time trackers I ran during high-volume campaigns only worked because the requisition and stage data underneath them was reconciled daily.
4
Step 4: Choose a Decision Metric for Every HR Reporting Audience
Assign each audience one primary decision metric and no more than four supporting ones. Structuring hr reporting by audience is what makes a stakeholder able to name their number.
| Audience | Primary decision metric |
|---|---|
| Hiring managers | Requisition aging |
| HR Business Partners | Regretted attrition by team |
| Executive committee | Internal fill rate for hard-to-replace roles, plus cost per hire trend |
| Board | Representation at leadership level, plus hard-to-replace role coverage |
Five numbers maximum per audience. An audience that cannot name their primary metric does not have one.
5
Step 5: Set the Baseline Before You Set the HR Metrics Target
Pull twenty-four months of the metric. Compute the trailing twelve-month mean and standard deviation, then express the target as a sustained move outside that range.
“Reduce Time-to-Fill to 30 days” is a worse target than “move Time-to-Fill below the lower bound of its current range and hold it there for two quarters.” The first produces false alarms and false victories. The second cannot be faked by one good month.
My 36-day engineering and 39-day volume benchmarks mean something only against the organization and role families that produced them. Imported into yours, they are trivia.
◆ PRO TIP
Pro tip: Insist on the two-quarter hold in the target wording itself. Without it, one quiet month of low-difficulty requisitions reads as an improvement, gets celebrated, and reverses in the next cycle with nobody able to explain why.
6
Step 6: Build the HR Analytics Narrative, Not the Dashboard
One page, four parts. Writing that four-part structure is where hr analytics stops being a system and starts being an argument.
- What changed
- Why it changed
- What it costs or saves
- What we are asking for
Write the four sentences first. Then decide which two charts support them, and cut every chart that supports neither.
My weekly hiring war-rooms ran on the same four parts at a weekly cadence: status, blocker, cost of the blocker, decision required. An executive reads the sentences and looks at a chart only to test a claim they want to challenge.
7
Step 7: Review and Retire HR Metrics on a Schedule
Every six months, one question per metric.
If nobody can name a decision it changed in the last two quarters, the metric is retired or demoted to an on-request view. A healthy first review retires about a third of what you report, so plan for that number instead of being alarmed by it.
Announce every retirement. A metric that silently disappears reads as something being hidden, and you will spend more time explaining the absence than you saved by removing it.
Name the decision this metric changed in the last two quarters.
The HR Reporting Cadence That Makes HR Metrics and Analytics Operational

Seven steps builds the system. Rhythm is what keeps it alive, and rhythm is the thing no competing page on this subject discusses at all.
Three layers. Three audiences. Three different decisions, and they never merge into one pack.
Weekly Operational HR Reporting
Four data points define the weekly layer of your hr reporting: requisition aging by stage, interview load by interviewer, offer-out and offer-pending counts, and any stage where a candidate has waited past your service threshold.
The format is a working tracker. Not a formatted report, not a deck, and nothing that takes an analyst two hours to prepare.
The decision it drives is what gets unblocked this week. Operating rule: anything on the weekly view must be actionable within seven days, or it belongs on the monthly.
I ran this as daily recruiter stand-ups against a real-time tracker, with weekly hiring war-rooms alongside them for the managers. Blockers surfaced the day they appeared instead of a month later, by which point the candidate has accepted somewhere else.
Monthly HRBP HR Metrics Review
Five numbers: regretted attrition by team, internal mobility rate, engagement variance by manager, Time-to-Fill trend against baseline, and the data-exception count from Step 3.
The decision this month’s review produces is which teams get intervention attention. Name them in the meeting or the meeting did not happen.
How to execute:
Open the pack with the four-sentence narrative from Step 6. Push the metric detail behind it as an appendix, and watch how differently the room reads it.
A monthly pack that opens with a data table gets skimmed. A monthly pack that opens with what changed, why, what it costs, and what you are asking for gets argued with, which is the outcome you want.
Quarterly Executive and Board HR Analytics Pack
Five metrics: hard-to-replace role coverage, internal fill rate, representation at leadership level, cost of HR per employee trend, and workforce plan variance against the hiring plan.
The decision is resource allocation and risk acceptance. Two pages including charts, with everything else available on request.
A board pack longer than two pages gets read by nobody and summarized by somebody with an agenda. Those are your two options, and you only control one of them.
◆ FROM THE LAB
My experience: the hardest test I have put a three-tier cadence through was a bulk hiring ramp of 350 to 500 roles, against a business start date 8 to 12 weeks out. Customer support, operations analysts, junior engineers, and sales support, all hiring at once, with limited interviewer capacity and a real risk of candidate drop-off at every stage.
We planned capacity backwards from the business date, forecasting recruiter bandwidth, interviewer availability, and sourcing throughput week by week. Sourcing ran across job portals, referral drives, early-career funnels, and SLA-tracked vendor partnerships. Screening moved to standardized pre-assessment criteria, batch interviews, and structured scorecards, with one point of contact per candidate batch and accelerated offer release.
The reporting ran on three rhythms simultaneously. Daily recruiter stand-ups on a live tracker. Weekly war-rooms with hiring managers. SLA reviews with vendors on submissions, shortlist ratio, and offer-to-join.
We delivered 420-plus hires in 10 weeks. Average Time-to-Fill fell from 32 days to around 18 to 20, offer-to-join held above 90%, ninety-day retention landed at 85 to 88% in line with our historical benchmark, and recruiter productivity rose by roughly 35%.
The three cadences never merged. That separation is the only reason the program stayed controllable, and the first thing I would protect if I ran it again.
Predictive HR Metrics and Analytics: What Works and What Doesn’t
Three cadences running cleanly puts you ahead of most functions. It also puts you within reach of the layer everyone gets sold before they are ready for it.
Some predictive work earns its keep at normal enterprise data volumes. Most of what gets demonstrated does not.
Where Predictive HR Analytics Earns Its Keep
Three applications work reliably. Each one has a data precondition attached, and the precondition is the useful part of this list, so start your hr analytics roadmap by checking which of the three you can support.
- Hiring demand forecasting from historical requisition patterns and the business plan. Needs three years of requisition history and a plan you trust.
- Time-to-Fill projection by skill and location for workforce planning. Needs enough fills per skill cluster to compute a distribution, not an average.
- Cohort-level attrition risk used to target retention investment. Needs two years of clean exit data and enough leavers per segment to model.
Cohort-level means cohort-level. A risk score is never used to label an individual, never used to influence a decision about that person, and never shared with their manager.
The value sits in resource allocation. Knowing which population to invest in beats knowing which individual to worry about, and it is the only use of the output that survives legal review.
Talent Market Pre-Alignment is the version I run on the supply side. Targeted competitions, challenges, and talent pools identify and engage people ahead of demand, so capability, interest, and availability are pre-aligned before requisitions open. It moves Time-to-Fill, Quality of Hire, and forecasting accuracy at the same time, because the forecast and the pipeline are the same artifact.
The Small-Sample Trap in Predictive HR Analytics
But here is the catch:
Below roughly 500 employees, or with fewer than about 50 events in the outcome class you are modeling, a predictive model fits noise and returns confident wrong answers.
The mechanism is simple. The model finds a pattern in the handful of leavers you have and generalizes it to everyone, and the output looks exactly as authoritative as a model built on ten thousand records.
⚠ WATCH OUT
Watch out: This is a data-volume limit, not a sophistication limit. No vendor, no consultant, and no amount of model tuning fixes it, and any demo that implies otherwise is selling you a confident guess.
◆ PRO TIP
The honest downside: If you sit below those thresholds, the alternative is not a smaller model. It is structured exit and stay interviews, coded consistently against a fixed question set, reviewed quarterly.
That produces better retention decisions at your scale than any model will, and it is a permanent answer rather than a stopgap you graduate from. Smaller organizations are not behind on predictive analytics. They are correctly invested elsewhere.
Agentic AI and the 2026 State of HR Analytics
Four things moved in the last eighteen months, and the shift in hr metrics software is easier to see in what recruiters stopped doing than in what any product claims.
The Old Way
- Keyword matching against the database
- Automated interview scheduling only
- Screening on credentials and titles
- Models that predict who to hire
The Lab Way
- Sourcing copilots running semantic search across existing records
- Agentic orchestration across the whole interview lifecycle
- Skills-first matching against verified competencies
- Models that flag who is likely to leave, enabling proactive retention
◆ FROM THE LAB
My experience: the agentic systems I work with have moved into pilot phases that look different from anything before them. They do not return an output for a human to act on. They execute the workflow.
What changed in practice was the split of labor. AI took the high-volume, low-judgment work, and recruiters took back the high-touch relationship building that the administrative load had been eating.
My own prompt frameworks cover four jobs: role clarity and skill translation, inclusive job description drafting, structured interview question design, and market-insight synthesis. Every one of them ends at a human validation point, because a prompt framework without a named validator is an automation, not a co-pilot.
AI does not replace recruiters. It replaces the parts of the job that stopped recruiters from being effective in the first place.
AI accelerates thinking. Recruiters own judgment, context, and the final call, and the moment that stops being true you have a compliance problem rather than a productivity gain.
⚠ WATCH OUT
Red flag: Three risks arrive with the same wave. An automation arms race, where volume rises because it can and nothing downstream was built for it.
Loss of personal contact at precisely the stages where contact converts. And algorithmic bias, where flawed training data reproduces historical hiring prejudice at machine scale and machine speed.
The executive appetite for forward-looking workforce analytics already exists. In a July 2025 Gartner survey of 426 CHROs, 42% listed strategic workforce planning as a top priority.
Source: Gartner HR Research, 2026, survey fielded July 2025, n=426
Translation: the mandate is not the constraint. Capability is.
Choosing HR Metrics Software Without Getting Sold
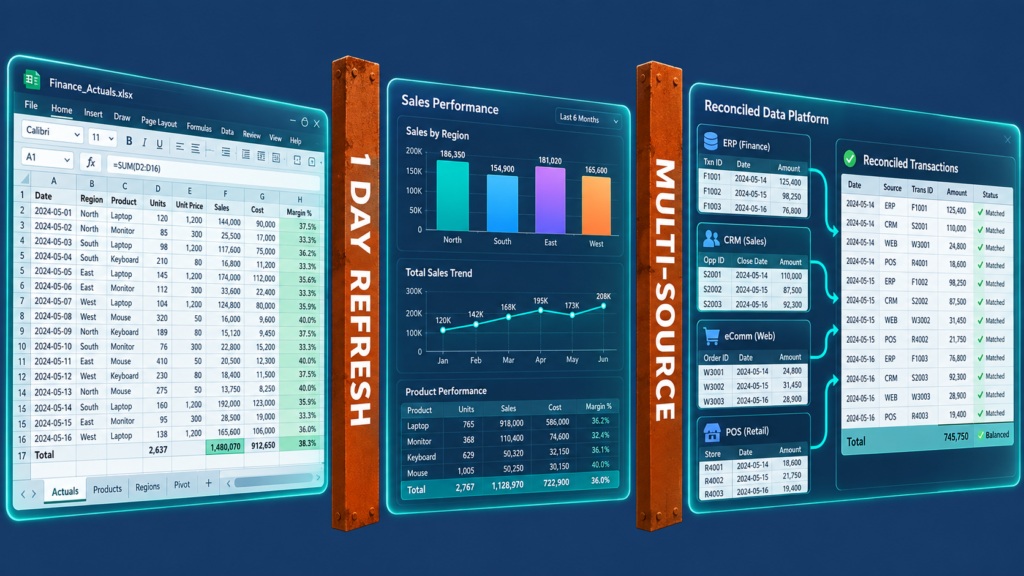
Nothing in this guide so far required a purchase. Which is deliberate, because tooling is the last decision and it gets made first almost everywhere.
Here’s the deal:
The route to hr metrics software runs through three stages, and each one has a specific condition that justifies leaving it. Skipping a stage costs more than staying too long in one.
Stage One — Spreadsheet-Based HR Metrics
It works. Full definitional control, no license cost, and a change you can make in the same hour you decide on it.
Where it breaks is predictable: manual refresh burden, version proliferation, no audit trail, and a single point of failure in whoever built it.
◆ PRO TIP
Real talk: Spreadsheets are not a temporary embarrassment you graduate from. For a stable metric set under about 500 employees, a well-governed spreadsheet is frequently the correct answer, and buying software to escape the feeling of being behind is how teams end up with a platform nobody logs into.
Two exit triggers, and you need only one. The monthly refresh takes more than one working day, or two versions of the same report are circulating.
Stage Two — The BI Layer for HR Analytics
Connect the HRIS and ATS to the general-purpose BI tool your organization already pays for. The definitions then live in your own semantic layer instead of in a vendor’s, which is worth more than it sounds.
Check what Finance already owns before you go to market. The incremental license cost is frequently close to nothing.
◆ PRO TIP
The honest downside: This stage needs somebody who can build and maintain a data model. That is a real skill hire or a real partnership with the data team, and pretending otherwise is the single most common way Stage Two fails.
HR-specific logic gets built by hand. Headcount as-of-date, tenure banding, and organizational hierarchy over time are not in any BI tool out of the box, and each one is a week of work you should budget for.
Stage Three — Dedicated HR Metrics Software
A purpose-built platform earns its cost under four conditions: multiple source systems needing reconciliation, a distributed HRBP population needing self-service, regulatory reporting across jurisdictions, or headcount past the point where a hand-built model stays maintainable.
Four questions decide whether the hr metrics software you are evaluating will still work in year two. None of them appear in a demo.
- Can we see and edit the metric definitions ourselves?
- What happens to our historical data if we leave?
- Does it reconcile to our HRIS out of the box, or does that stay our problem?
- What is the total cost including the implementation partner?
⚠ WATCH OUT
Watch out: Weight the exit-data answer heaviest of the four. A vendor who cannot tell you plainly what you leave with is telling you the answer, and by the time it matters you will have three years of history you cannot move.
This section names no people-analytics platform. HR Insights Lab has no product to sell and no affiliate arrangement, which is exactly why it can afford not to.
My published tool assessments recommend and warn about the same products depending on who is holding them. LinkedIn Recruiter is the strongest professional sourcing platform I have used for niche and leadership roles, and the wrong choice for high-volume or cost-sensitive hiring. Avature is powerful for enterprise teams with ATS admins and process maturity, and wrong for lean teams who want simplicity.
Neither verdict works as a recommendation on its own. That is the standard to hold any evaluation to, including the one you are about to run.
The Legal Limits of HR Metrics and Analytics in the US
Measuring people is a regulated activity in the United States. Not one page ranking for this term mentions that, which tells you something about who writes them.
What follows flags the obligations and stops. It is not legal guidance, and state-level AI employment law is changing fast enough that you must confirm current obligations in every jurisdiction you hire in.
Adverse Impact and Selection-Rate HR Metrics
Once you measure selection rates by protected group, those measurements can become evidence in a discrimination claim, and the four-fifths rule under the EEOC’s Uniform Guidelines on Employee Selection Procedures is the standard US reference point for adverse impact analysis.
Measuring is still the right thing to do. Not measuring provides no protection whatsoever.
⚠ WATCH OUT
Warning: Involve employment counsel before the analysis methodology is fixed, not after the first results land. How the analysis is commissioned carries legal privilege considerations that are a counsel question and not an HR one.
Automated Decision Tools and HR Analytics Compliance
Predictive and AI-assisted hiring tools carry direct regulatory obligations in the US today. New York City Local Law 144 requires an annual independent bias audit and candidate notice for automated employment decision tools, and Illinois HB 3773 extends the state’s Human Rights Act to cover AI use in employment decisions.
References: NYC Local Law 144 of 2021, automated employment decision tools. Illinois HB 3773 (2024), amending the Illinois Human Rights Act.
The state-level position is in flux. Confirm current obligations in every jurisdiction you hire in, and involve legal counsel before any predictive scoring reaches a hiring decision.
⚠ WATCH OUT
Red flag: AI tooling reads as a technology decision and routes through IT and procurement. Treat it as a compliance decision with a technology component instead, and route it through counsel before deployment.
The operating principle I hold to, AI as co-pilot with human-led validation at every decision point, is also the posture these regulations are written to require. That alignment is not a coincidence.
Employee Data Privacy in HR Reporting
HR analytics operates on personal data subject to state privacy law. The California Consumer Privacy Act as amended now covers employee and applicant data, and organizations with employees outside the US will carry GDPR obligations alongside it.
Two design controls belong in any hr reporting design regardless of jurisdiction, and both are decisions you make before the first view is built.
- Minimum group size for any segmented report, typically five or more, so no individual is identifiable from a single cell
- Role-based access, so a manager sees their own team and nothing beyond it
⚠ WATCH OUT
Common mistake: Segmented reporting routinely makes individuals identifiable in small teams without anyone intending it. A four-person team’s engagement breakdown is not anonymous data, whatever the tool calls it. Take counsel on retention periods and cross-border transfer.
Benchmarking HR Metrics and Analytics Against the Right Baseline
One question remains, and it is the one that undoes everything above if you answer it lazily. Against what?
When External HR Metrics Benchmarks Mislead
Published benchmarks fail as targets for four specific reasons. They blend industries with structurally different hiring patterns. They rarely publish their metric definitions, so you cannot know whether their Time-to-Fill starts where yours does.
They are self-reported by organizations with an incentive to look competent. And they lag by twelve to eighteen months, which in a moving labor market is a different world.
The Old Way
- Set the target at the published industry benchmark
- Explain the gap every quarter
- Never learn whether the definitions even matched
The Lab Way
- Use benchmarks as an order-of-magnitude sanity check
- Set targets from your own trailing baseline
- Build market comparisons from the specific market each role sits in
Here is the sanity-check rule for reading anyone else’s hr metrics. Your Time-to-Fill is 45 days and the benchmark says 42? That is noise. Yours is 95? That is a signal worth a week of investigation.
◆ PRO TIP
The catch: There is a version of benchmarking that does inform a decision, and it is not the published kind. Competitor and talent-landscape analysis, run skill by skill and industry by industry, comparing global against domestic hiring patterns and how competitor teams are structured, tells you what the market for this specific role looks like right now.
I run it on a schedule, the same way I run the escalation triggers. A blended average across four industries cannot do that job, and no amount of sourcing it from a better report will fix it.
Building Your Internal HR Analytics Baseline
Four moves build a baseline worth measuring against, and the whole method for internal hr analytics comparison sits in them.
- Pull twenty-four months of history for every metric in the reported set
- Compute the trailing twelve-month mean and the normal variance range
- Document any event that distorts a period, a restructure, an acquisition, a hiring freeze, and annotate it permanently on the chart
- Re-baseline on a scheduled annual cycle, never in reaction to a bad quarter
Why this works:
The annotation discipline matters more than it sounds. In two years nobody in the room will remember why Q3 looked like that, and an unexplained outlier eventually gets treated as a trend by someone building a case.
◆ FROM THE LAB
The Sofia lens: 36 days on engineering roles. 39 days on volume hiring. 89% twelve-month cohort retention. 90% offer acceptance at its high-water mark.
Those four numbers are only legible because I held them against the same definitions, year after year, and annotated the periods where something structural moved. Change the denominator once without recording it and the whole series becomes decoration.
A benchmark is not a number you find. It is a number you have kept.
HR Metrics and Analytics FAQ
What Is the Difference Between HR Metrics and HR Analytics?
HR metrics are the measurements, counts, rates, and ratios produced on a schedule, while HR analytics is the investigative layer that explains why those measurements moved and what to do next. Metrics are judged on accuracy. Analytics is judged on whether a decision changed as a result.
What Are the Four Types of HR Metrics and Analytics?
Descriptive (what happened), diagnostic (why it happened), predictive (what will happen), and prescriptive (what to do about it). Most HR functions operate almost entirely in the descriptive layer. Each level needs more historical data than the last, which is the real constraint on moving up.
Which HR Metrics Should a Company Track First?
Start with regretted attrition segmented by manager, Time-to-Fill against your own baseline, internal fill rate for hard-to-replace roles, and cost of HR per employee. Four metrics that each carry a named owner and an attached decision beat twenty that carry neither.
How Do You Measure the ROI of HR Analytics?
Convert the metric change into a dollar figure, then multiply it by next year’s volume. If cost per hire falls $4,000 and the plan calls for 40 senior hires, the return is $160,000 against the cost of the analytics investment. Percentage improvements do not get budget approved. Annualized dollars do.
Do You Need HR Metrics Software to Run HR Analytics?
No. Under roughly 500 employees with a stable metric set, a well-governed spreadsheet is frequently the right answer. Move to a BI layer when the monthly refresh exceeds one working day, and to a dedicated platform only when multiple source systems need reconciliation.
Start With One HR Metric and One Dollar Figure
The organizations whose people data moves a decision are not the ones measuring the most. They are the ones whose numbers are denominated in something the business already makes decisions in.
What separates the functions that execute from the ones that do not is willingness to retire a metric, publish a definition, and put a dollar figure next to a day. None of that requires new software.
So pick two things this quarter. Write the definition for the one metric your leadership argues about most, with the owner named and the date on it. Compute a cost-of-vacancy figure for a single job family.
Hold both for two quarters. Then bring the dollar figure to the meeting instead of the day count, and watch what the room does differently.
If you are building this inside your own organization, I would rather compare notes than lecture. Connect with me on LinkedIn and tell me which metric you retired first.
