

I have spent eight years building talent acquisition systems inside a large engineering organization, running 250-plus hires a year. The requisition always arrives the same way.
The business has already decided it needs the person. By the time the approval clears and the role reaches your desk, that decision is weeks old, and you are asked to deliver in six weeks what the market takes fourteen weeks to produce.
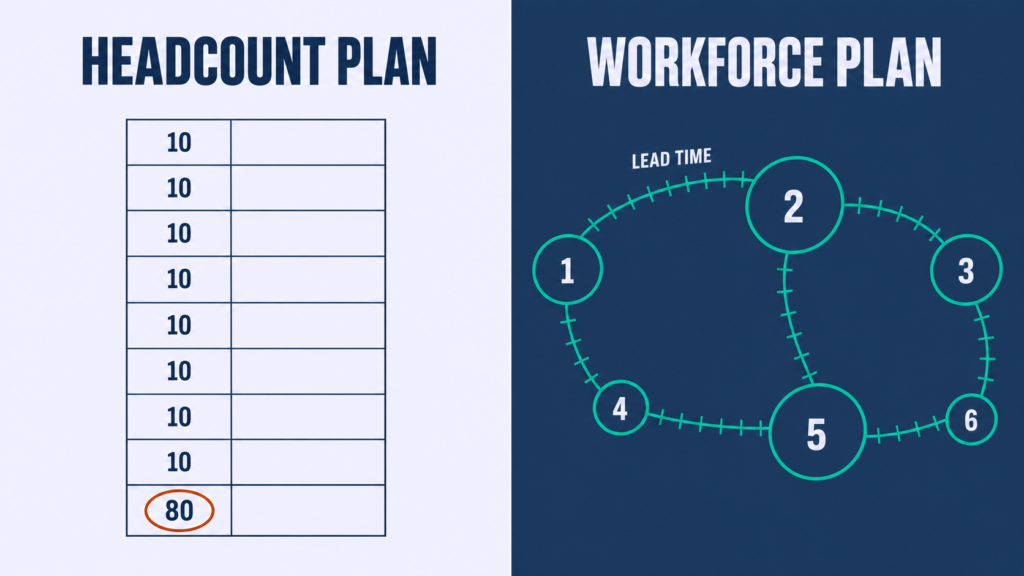
Most organizations call this workforce planning. What they have is a headcount spreadsheet with a forecast column.
A headcount plan tells you how many people you are allowed to hire. A workforce plan tells you which capabilities the business will fail without.
The distinction costs money the moment it goes unnoticed. An unfilled senior engineering role drains roughly $500 a day in lost output, so sixty days of vacancy is $30,000 gone, and that is one role on one team.
$30,000
Lost productivity from a single senior engineering role left open for 60 days, at $500 per day.
The vacancy is the cheap part. The expensive part is twelve months of hiring decisions pointed in the wrong direction, which is what you get when the plan underneath them was a budget wearing a forecast’s clothes.
If that sounds like your organization, it is close to universal. Gartner research found that only 31% of recruiting functions use labor market data to shape business and talent strategies. Translation: roughly seven in ten talent functions are forecasting from internal assumption alone, and the market is the variable they are guessing at.
Source: Gartner HR Research, February 2026
This guide is the operating system underneath the definition. By the end of it you will have:
- The four analyses every workforce planning cycle runs on, and the one most teams skip
- A 7-step workforce planning build you can run in a quarter, not a year
- A method for forecasting demand when the business will not give you numbers
- The build, buy, borrow, and automate math, with real cost per hire figures attached
- The metrics that get the plan funded again next year
HR Insights Lab approach: every benefit below carries a mechanism, a number, and the condition under which that benefit fails to appear. Where I have no evidence, I give you the argument and say so.
What Is Workforce Planning?
Workforce planning is the process of matching an organization’s future capability needs to its available talent supply, by forecasting demand, auditing current supply, sizing the gap between the two, and deciding how that gap gets closed. The output is a set of decisions about where capability comes from, not a headcount total.
On a Tuesday, that looks like one document doing one job. It is the document that tells a hiring manager in March why the two roles they want in June were anticipated back in January, and where the shortlist for those roles already sits.
The Lab frames workforce planning as a talent supply chain, because that is what the good version behaves like. A supply chain is circular. It predicts demand, holds inventory in the form of pre-warmed talent communities, and optimizes for long-term cost and quality across cycles.
A hiring plan is linear. Open, source, close, repeat, and measure yourself against time-to-fill benchmarks that were set by how fast you could react, never by how early you could start.
Here’s the difference:
A hiring plan describes activity. A workforce plan describes risk, which is why one of them gets read by the executive team and the other gets filed.
Workforce Planning vs. Headcount Planning
This is the distinction the ranking guides skip, and it is the one that decides whether your plan survives the year. Headcount planning answers how many people the budget allows. Workforce planning answers which capabilities the business will fail without, and where those capabilities will come from.
One is a finance output. The other is a business-risk output. You can run the test on your own plan this afternoon with two questions.
- Open the plan in month seven, after the business has pivoted. Does it tell you anything useful, or does it only tell you what you were allowed to spend?
- Does the plan name capabilities, or does it name job titles and a number?
A plan that only survives a stable year is a headcount plan wearing a workforce planning label. The consequence shows up in how each one gets revised: headcount plans are renegotiated in budget season, and workforce plans are re-forecast when the business changes.
The Old Way
- Collect headcount requests from every manager
- Sum the requests into an annual number
- Negotiate the number down in Q4
- Freeze the spreadsheet until the next Q4
- Explain in month seven why the plan no longer matches reality
The Lab Way
- Name the capabilities the business plan depends on
- Project supply forward with attrition applied
- Rank the gaps by consequence and scarcity
- Attach a build, buy, borrow, or automate decision to each
- Re-forecast on published triggers, not on the calendar alone
The operational answer to “what does a real workforce plan produce” is not a number. Through Intelligence-Led Sourcing, which is continuous market mapping run before vacancies exist, the plan produces pre-identified supply. Capability mapping turns a strategy slide into a list of named people in named companies, and that list is what gives the plan something to stand on.
◆ PRO TIP
Real talk: finance will keep calling this headcount planning no matter what you put on the cover page, and arguing about the label is a fight worth losing. What matters is that HR does not internalize the framing. Present the cost envelope in their language and hold the capability logic in yours.
Workforce Planning vs. Workforce Management
Here’s the difference:
Workforce management is the operational layer: scheduling, time and attendance, shift coverage, and labor compliance in the current period. Workforce planning sits upstream and sets the horizon, deciding which capabilities are needed, how many, by when, and from where.
One optimizes this week’s roster. The other decides what the roster should be made of in eighteen months.
Place your own tooling against that split and the confusion clears. An HRIS holds the record, a workforce management tool runs the week, and a planning model runs the horizon. The forecasting tab inside a scheduling product is not the third thing.
Strategic Workforce Planning and Operational Workforce Planning: The Horizon Split
Here’s the deal:
Operational workforce planning covers zero to twelve months: known requisitions, backfills, attrition replacement, and seasonal volume. Strategic workforce planning covers eighteen months to five years: capability shifts, build-versus-buy decisions, location strategy, and succession planning depth.
Most teams claim the strategic version and run the operational one with a longer spreadsheet. The giveaway is simple. Open the plan and look for a capability that does not exist in the organization today, because a strategic plan that contains none of those is a projection, not a strategy.
Talent Market Pre-Alignment belongs in the strategic column, and it is the mechanism that makes the column real. The method identifies and engages talent ahead of demand through targeted competitions, challenges, and pre-built pools, so capability, interest, and availability are settled before the requisition opens. The full comparison table sits further down in this guide.
⚠ WATCH OUT
Common mistake: extending the operational spreadsheet from twelve months to thirty-six and calling the result a strategic plan. Adding rows to a projection does not convert it into a strategy. If every line in year three is a job title that exists in year one, the plan has assumed the business will not change.
What Is Workforce Planning in HR? Who Owns Workforce Planning, and What HR Is Accountable For
In HR, workforce planning is the function’s accountability for translating business strategy into a capability forecast. HR owns the supply data, the skills taxonomy, the attrition model, and the sourcing plan. Finance owns the cost envelope. The business owns the demand signal.
Nobody owns all three, and that is the whole political problem in one line. Make the boundary explicit before the first planning meeting, because the boundary is what you will be defending in month seven.
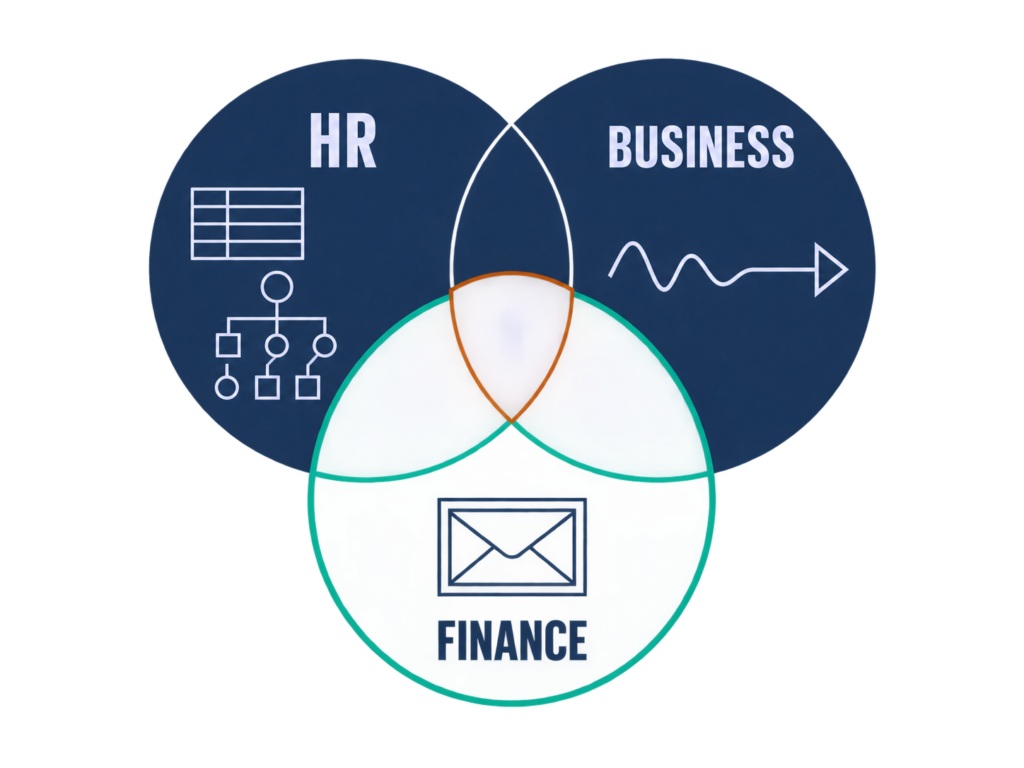
- HR owns supply, capability definition, and the sourcing plan
- Finance owns the cost envelope and the approval gate
- The business unit owns the demand signal, and the accountability for the forecast it gave
The most common dysfunction in the HR business partner role sits in that third line. HR is held accountable for a demand number it did not produce and has no standing to challenge, which is how a talent acquisition strategy becomes an order-taking function with a dashboard.
◆ FROM THE LAB
The Sofia lens: I stopped challenging demand numbers in the meeting where they were presented. It never worked, because the challenge landed as HR pushing back on the business without anything to push back with.
What changed the room was arriving with market intelligence nobody else in it had. When my team held continuous mapping of the competitor set, I could tell a business leader that the three roles they had forecast for Q2 represented a regional pool of a specific size, with a specific number of people who had moved in the last eighteen months. That is not a challenge to their number. It is a supply fact placed next to their number, and it lets them revise their own forecast without losing face.
Here’s how to build it:
Four capabilities have to exist before HR can plan credibly. Build them in order, because the order is what decides whether the effort survives contact with executive patience.
- Clean attrition data, segmented by team, tenure, and regretted versus non-regretted exits
- External labor market data for the roles that carry the most business consequence
- A skills taxonomy the business recognizes, not a competency library nobody opens
- A standing relationship with FP&A that exists outside budget season
Start with the attrition model. It is buildable in about three weeks from data HR already owns, and a credible attrition forecast is the number that makes finance listen, which buys the political capital to fund the other three.
An attrition number is only useful once it is segmented. My own retention figures are held by cohort and by horizon, never as one company-wide average: a best twelve-month cohort retention rate of 89% sits alongside 85% to 88% ninety-day retention from a high-volume campaign, and those two numbers describe completely different risks. Company-wide retention hides both, which is why employee retention reported as a single percentage has never moved a planning conversation.
That segmentation is the foundation of every HR metrics that matter conversation you will have with finance.
◆ PRO TIP
The honest downside: your year-one attrition model will be wrong. Small segments produce unstable rates, and one team of six leaving together will distort a number that looked settled in January.
Publish a confidence range, never a point estimate. “We expect 12% to 16% attrition in engineering, and here is what moves it to either end” survives a miss. A single number presented with false precision does not, and losing that argument once costs you the next three planning cycles.
Why Workforce Planning Is Harder in 2026 Than in 2019
For twenty years, a US workforce plan could rest on one assumption: if the budget existed, the people existed. Planning was a budgeting problem, and a flexible market absorbed the forecasting error quietly enough that nobody counted the cost.
That assumption is now false. The Bureau of Labor Statistics projects the US economy will add 5.9 million jobs between 2025 and 2035, with total employment rising from 170.3 million to 176.2 million. That is growth of 3.5%, against 10.9% over the 2015 to 2025 decade.
3.5% vs. 10.9%
Projected US employment growth for 2025 to 2035, against the growth recorded across 2015 to 2025.
Source: U.S. Bureau of Labor Statistics, Employment Projections 2025 to 2035
Translation: the pool your plan draws from is growing at roughly a third of last decade’s rate, so the margin for a wrong forecast has shrunk by the same order. The operational consequence is the part worth sitting with.
When supply is flat, a bad forecast stops being a delay and starts being a permanent capability gap.
The person you did not plan for in Q1 is not waiting for you in Q3. They are employed by the organization that planned earlier.
This is why the Lab treats talent as inventory inside a constrained talent supply chain. You secure capability before you need it through a live talent pipeline and passive candidate sourcing, or you do not get it at the moment you need it.
The instinct when supply tightens is to raise the offer. I have watched that fail enough times to say it flatly: pay works up to a threshold, and past that threshold you are inflating fixed cost without changing availability. A scarcity problem does not respond to money the way a competitiveness problem does.
Why this matters:
The second structural shift is quieter, and it attacks the plan’s unit of measurement. Workforce plans are built on job titles: headcount by role, by level, by location. The job itself has become an unreliable container for the work.
Deloitte’s research puts numbers on it. 71% of surveyed workers perform work outside their job descriptions, and in a typical organization 5% of roles carry 95% of business impact.
Source: Deloitte Insights, “From jobs to skills to outcomes: Rethinking how work gets done,” October 2025
Read those two figures as one argument. If 71% of people are doing work outside their job description, a plan expressed in job titles is forecasting a fiction. If 5% of roles carry 95% of the impact, you do not have to fix every job to fix the plan.
So run a two-speed plan. Plan the top ten roles by business impact at capability level, and leave everything else at headcount level, which ships this quarter and gets the accuracy where the consequence sits.
On the sourcing side, the same shift shows up as Inverted Sourcing Funnels: filtering on capability signals like project evidence, published work, portfolios, and repository activity, not on resume keywords. Skills-based hiring is what capability-level planning looks like once it reaches the market, and the job architecture work can follow later.
⚠ WATCH OUT
Anti-pattern: the eighteen-month skills taxonomy project undertaken as a prerequisite to planning. It produces a library nobody outside HR uses, it consumes the executive patience you needed for the actual plan, and it ends with a capability vocabulary that hiring managers quietly ignore.
Build the taxonomy for ten roles. Prove it in one planning cycle. Extend it only when a hiring manager asks you to.
The Real Benefits of Workforce Planning, With the Numbers Attached
Every guide on this topic runs a benefits list, and most of them run twelve items that cannot be falsified. Enhanced agility. Improved alignment. Better decision-making. You cannot take any of those into a budget meeting.
You are being asked to justify an investment, which means you need benefits a CFO can audit. So here are four, and each one carries a mechanism, a number, and the condition under which the benefit fails to show up.
The question is not academic at executive level. Gartner’s survey of 426 CHROs found that 42% listed Strategic Workforce Planning as a top priority, while only a small fraction said their planning was agile enough to respond to unforeseen circumstances. The intent is already there. The execution is the gap.
Source: Gartner HR Research, survey of 426 CHROs, July 2025
Here’s the deal:
Four defensible benefits beat twelve decorative ones, and the failure conditions are what make them defensible.
Cost Per Hire Falls, Because Urgency Falls
Unplanned hiring is expensive for a specific reason, and it is not incompetence. When the requisition is urgent, you buy speed.
You buy it through recruitment agency fees at 18% to 22% of compensation. You buy it through premium offers that shorten negotiation. You buy it through a compressed assessment that raises the odds of a mis-hire you end up paying for twice.
Workforce planning does not make hiring cheaper by negotiating better rates. It makes hiring cheaper by removing the urgency that made hiring expensive.
◆ FROM THE LAB
Real implementation: on senior engineering roles, my cost per hire moved from roughly $7,800 to $9,000 down to roughly $3,600 to $4,600. That is a 45% to 55% reduction, and time to fill came down from 70 to 80 days to 45 to 50 days across the same population.
The drivers were not clever. Internal sourcing and referrals replaced agency spend, and the shorter cycle removed the premium we had been paying to compress it. On a total compensation package of $54,000 to $60,000, a single agency placement was running $9,500 to $12,000. Removing four of those from a year is not a rounding error in an HR budget, and it is the first number I would take into a conversation about funding a planning cycle.
◆ PRO TIP
The catch: this saving does not arrive because the plan exists. It arrives because requisitions stop landing unplanned.
If the document gets built and the business keeps dropping urgent roles on you in month four, your cost per hire will not move a cent. The saving comes from behaviour change, and the plan is only the instrument that makes the change visible.
Time-to-Fill Drops Before You Post the Job
Planned hiring is fast for a reason nobody puts in the process-improvement deck. The expensive part of a search is not interviewing. It is finding and warming the candidate.
Planning moves that work to before the clock starts. Run the arithmetic: if 34 days of a 68-day cycle are market discovery, and discovery already happened, the cycle halves without a single process improvement anywhere downstream.
68 → 34 days
Average Time-to-Offer on automation engineering roles, before and after talent mapping with pre-identified candidate pools.
◆ FROM THE LAB
My experience: earlier in my career I was asked to scale an automation engineering team inside a large industrial organization. The brief was the usual one. Growth was coming, nobody could tell me exactly when, and the roles would be niche enough that the internal assumption was six months per hire.
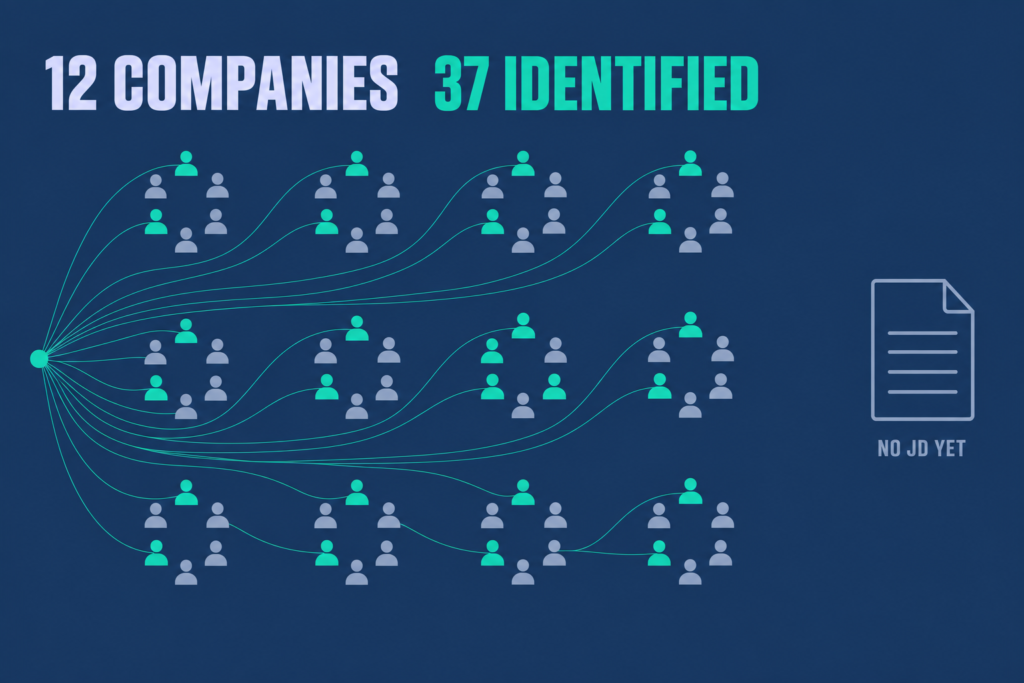
I did not wait for the requisitions. My team spent eight weeks mapping twelve companies across the industrial IoT space, building a picture of who held the capability, where they sat, how long they had been there, and what was likely to move them. No outreach about a specific job, because there was no specific job yet. Just capability mapping and light, honest conversations about the work.
By the time the first job description was written, we had 37 qualified candidates already identified. Average Time-to-Offer on that population fell from 68 days to 34.
The transferable lesson is not about mapping tools. It is that proactive mapping beats reactive posting every time, because the half of the cycle that hurts is the half you can move before the clock starts.
The effect holds at volume, not only on niche roles. On a high-volume campaign of 420-plus hires, average Turnaround Time (TAT) came down from 32 days to roughly 18 to 20 days using the same principle applied to scale: build the funnel against a forecast, not against a vacancy.
Talent Market Pre-Alignment is the named method underneath both results. Engage capability ahead of demand, so interest and availability are settled before the requisition opens, and your time-to-fill stops measuring your reaction speed and starts measuring your preparation.
⚠ WATCH OUT
Watch out: pre-identified pools decay, and they decay faster than anyone budgets for. A map built eighteen months ago is a list of people who have since moved, been promoted, or stopped answering.
A stale pool produces worse outcomes than no pool at all, because it creates false confidence. The hiring manager is told the pipeline exists, the search starts late on that assumption, and you lose the weeks you thought you had banked. Refresh on a cycle, or do not claim the pool.
Internal Moves Replace External Hires
Most articles sell internal mobility on retention and cost. For a planning audience, the stronger argument is ramp time, because ramp time converts an HR benefit into an operations benefit.
An internal hire already holds the systems knowledge, the relationships, and the organizational context that an external hire spends two months acquiring. You are not buying a cheaper person. You are buying productive capacity several weeks earlier.
◆ FROM THE LAB
The Sofia test: we had a cost problem and a ramp problem at the same time, and we were treating them as separate. External hiring was expensive and slow to productivity, while capable people already on payroll were finding out about open roles from LinkedIn.
So we built the First Look Policy. Every role posted internally for 48 hours before it went external, with recruiters actively tapping internal candidates during that window instead of waiting for applications. The active tapping was the part that mattered. An internal job board nobody checks is a policy, not a mechanism.
Internal hire rate reached 23%. Average Time-to-Productivity for those moves was 28 days, against 67 days for external hires filling comparable roles, which is 40% to 50% faster to contribution.
The lesson I did not expect: your best candidates are sometimes already on payroll, and the only reason you are not hiring them is that nobody asked.
The Old Way
- Post everything externally on day one
- Publish roles to an internal board nobody opens
- Wait for internal applications that never arrive
- Let managers quietly block transfers
- Pay external rates and wait two months for output
The Lab Way
- Hold a 48-hour internal-first window on every role
- Have recruiters tap named internal candidates directly
- Track internal fill rate as a standing metric
- Measure managers on talent released, not only talent held
- Report Time-to-Productivity next to cost per hire
◆ PRO TIP
Real talk: internal mobility only works if managers are measured on releasing talent. In most organizations they are measured on the opposite, which is delivery against a plan that a departure puts at risk.
A manager who loses a high performer to another team and gets nothing for it will block the next move, and they will do it politely enough that you never see the block. Fix the incentive or accept the ceiling. Employee retention at organizational level and talent hoarding at team level are the same behaviour viewed from two heights.
Hiring Quality Improves When You Choose Earlier
Here is the counter-intuitive part. Quality of Hire is mostly decided before the interview, by the size and relevance of the pool you are choosing from.
Better assessment on a weak pool produces a well-assessed weak hire. You have improved your confidence in the decision without improving the decision.
A better scorecard applied to the wrong shortlist gives you a well-documented mistake.
Why this works:
Planning improves quality because planning widens the choice set in advance. The structured interviews still matter, and they matter more once the people sitting in front of you are worth choosing between.
◆ FROM THE LAB
My experience: I have measured Quality of Hire improvement three separate times, against three different upstream changes, and each one moved the number on its own.
Running competition analysis before opening the search improved quality by 12%. Building a talent landscape view across similar industries, so we were not fishing in one talent pool, improved it by 14%. Building a skill-based talent pipeline after market analysis improved it by 30%.
Those are three separate initiatives with three separate measurements. They do not stack into one compounding figure, and I would not present them that way to a CFO who can do arithmetic.
One more signal from the same period: an offer acceptance high-water mark of 90%. Pre-aligned candidates are not being persuaded cold. They have known about the work for months, which is why the offer conversation is short.
Retention gives you the fourth reading on the same question. A best twelve-month cohort retention rate of 89% tells you that the people chosen from a wider, better-understood pool were still there a year later, which is the only version of hiring quality that finance actually feels.
Four benefits, four mechanisms, four failure conditions. Adding a fifth without those three things would undo the advantage the first four just built.
The Four Analyses Every Workforce Planning Process Runs On
Supply, demand, gap, solution. Every credible workforce planning method runs on these four, and most guides define each one in two sentences before moving on.
How to execute:
Each analysis below gets three things the two-sentence version leaves out: the input data it needs, the artifact it produces, and the failure that kills it most reliably.
1
Supply Analysis: What You Already Have
The inward-facing audit, and the only one of the four whose data already sits inside your organization. The constraint here is quality and segmentation, never availability.
Pull these inputs:
- Current headcount by role and location
- Tenure distribution and performance distribution
- Capability inventory for the impact roles only
- Employee attrition segmented by team and by regretted versus non-regretted
- Retirement and planned-exit visibility
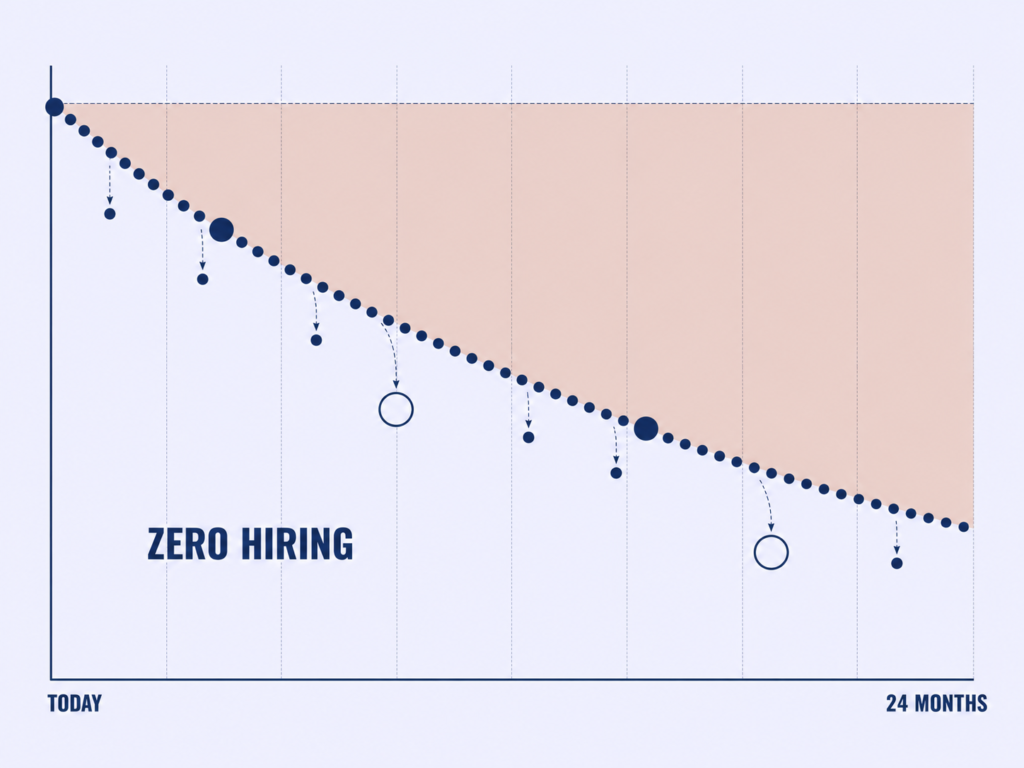
The artifact is a supply baseline projected forward 12 and 24 months assuming zero hiring. That projection is the erosion curve, and it is the single most persuasive object you can carry into a planning conversation, because it shows leadership what happens if nothing is done.
Building it is where HR analytics earns its keep, and it does not require a data science function. It requires attrition held at cohort level, which is how I have always held mine: a best twelve-month cohort retention rate of 89% next to 85% to 88% ninety-day retention on high-volume roles. Two numbers, two different risks, one credible curve.
⚠ WATCH OUT
Common mistake: counting people and calling the result supply. Supply is capability-weighted.
Losing one of your three PLC programmers is not the same event as losing one of thirty support analysts, and a headcount report shows both as minus one. Weight the curve by consequence or the curve will tell you a comfortable lie.
2
Demand Analysis: What the Business Will Need
The hardest of the four, because demand analysis depends on information HR does not control. It is treated most superficially in every guide for exactly that reason.
A business plan says “enter two new regional markets and launch the connected product line.” That is not a demand signal. It becomes one when you decompose it.
How to execute:
Build a four-column translation table, one row per business initiative: initiative, capability required, headcount implication, and lead time. Business partnering is what gets you the first two columns. Market knowledge is what gets you the fourth.
Lead time is the column that changes the conversation, because it is the one the business has never considered. A leader who hears “that capability takes fourteen weeks to acquire in this market” starts planning differently in the same meeting, without anyone having to challenge their number.
The artifact is a demand forecast expressed by capability and by quarter. Where no business plan is forthcoming at all, the method for building demand anyway is covered further down in this guide, and strategic workforce planning without that method is where most teams stall permanently.
3
Gap Analysis: The Difference That Matters

Gap equals demand minus projected supply, per capability, per horizon. That is the easy part and it deserves one paragraph.
The value sits in the ranking. Score each gap on two axes: business impact if the gap goes unfilled, and scarcity in the market. Then plot them.
High impact plus high scarcity is where planning effort belongs, because those are the roles where an eighteen-month lead time decides whether you have a plan or a scramble. Low impact plus high availability should be handled reactively, and handling it reactively is a decision, not a failure. Planning capacity is finite and spending it evenly is how it gets wasted.
The concentration principle established earlier in this guide is the external validation: 5% of roles carry 95% of business impact. Critical role identification is the whole exercise, and succession planning hangs off the same shortlist.
A plan that treats every role as strategic is a plan that will be abandoned by March.
◆ PRO TIP
Pro tip: score scarcity from your own ATS before you buy external market data. Posting-to-hire time by role, offer decline reasons, and the number of searches that needed an agency tell you where your market is thin, and that data is free, current, and specific to your employer brand.
External data is the second pass. It tells you whether the scarcity is the market’s or yours, and those two problems have different fixes.
4
Solution Analysis: How the Gap Gets Closed
Four options close a capability gap. Build the capability internally, buy it from the external market, borrow it through contingent workforce or partner capacity, or automate the need away.
Here’s the deal:
Four criteria select between them: the lead time available, the half-life of the capability, the cost of being wrong, and whether the capability is differentiating or supporting.
The rule of thumb holds up in practice. Differentiating capabilities with long lead times should be built or bought early. Supporting capabilities with short lead times should be borrowed or automated.
The First Look Policy is what this decision looks like when an organization institutionalizes it. A 48-hour internal window is a structural forcing function that tests build and internal mobility before buy gets a turn. The cost arithmetic for all four options comes next.
The Old Way
- Every gap becomes a requisition
- Hiring wins by default, because HR owns hiring
- Development budget is spent by function, not by gap
- Contractors appear only when a freeze bites
The Lab Way
- Every gap is tested against all four options
- Hiring has to win on the merits, in writing
- Development targets named gaps in the ranked top ten
- Contingent capacity is chosen deliberately, against short horizons
How to Build a Workforce Plan: The 7-Step Workforce Planning Blueprint
Ten to twelve weeks. That is the first cycle, not twelve months, and saying so up front matters because the twelve-month assumption is the objection that stops people starting.
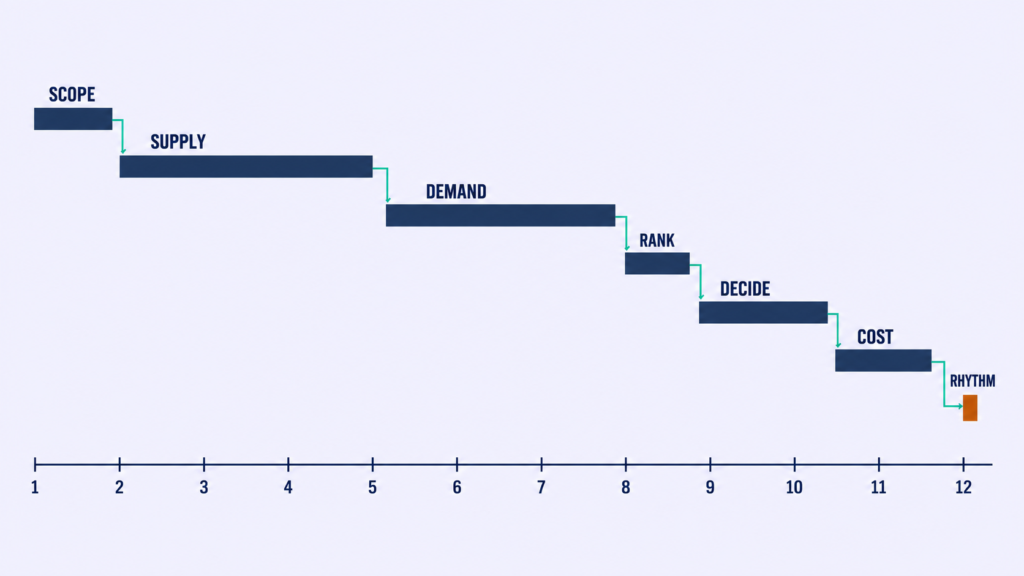
Here’s how to build it:
Each step below names what it produces, who signs it off, and how long it takes. A workforce planning process that cannot answer those three questions per step is a description, not a blueprint.
1
Step 1: Lock the Planning Horizon and Scope
Before any data gets pulled, settle two things: how far out the plan looks, and which population it covers.
Default to an 18-month strategic horizon with a rolling 12-month operational layer inside it. Scope the first cycle to one function or one business unit, never the whole organization, because a first cycle scoped to everything produces nothing anyone uses.
Horizon discipline is a habit worth borrowing from volume hiring. On a bulk campaign I ran, weekly hiring targets were mapped backward from the date the business needed people productive, not forward from what the recruiting team felt able to deliver. The end date sets the plan. The plan does not set the end date.
Artifact: a one-page scope statement naming the horizon, the population, and the three business questions this plan has to answer. Owner: HR, signed off by the business unit leader. Elapsed: 1 week.
2
Step 2: Build the Supply Baseline
Run the supply analysis. Pull headcount, tenure, performance distribution, and segmented attrition rate, then project 12 and 24 months forward with zero hiring applied to produce the erosion curve.
Build attrition by segment first and accept a confidence range. The minimum viable data set is headcount, exit dates, team, and tenure, all of which your HRIS already holds. Everything beyond that is refinement you can add in cycle two.
Segmentation is the whole trick here, and HR analytics at this stage is arithmetic rather than modelling. Cohort-level retention held separately by horizon, the way I hold an 89% twelve-month figure apart from an 85% to 88% ninety-day figure, is what makes an erosion curve defensible in a room full of people who want to argue with it.
Artifact: the supply baseline with its erosion curve. Owner: HR or People Analytics. Elapsed: 2 to 3 weeks.
◆ PRO TIP
The honest downside: waiting for the HRIS cleanup project to finish is how three years pass without a plan. The data will be imperfect in cycle one and the model will be wrong at the edges.
Build with what you have, publish the confidence range, and let the specific gaps in the data become your business case for fixing them. “We cannot segment regretted attrition because exit reasons are not coded” is a far better funding argument than a request to improve data quality in the abstract.
3
Step 3: Translate Business Plans Into Demand
Run the demand translation as a structured 90-minute session per business unit, working through the four-column table: initiative, capability required, headcount implication, lead time.
How to execute:
Bring the erosion curve into that meeting. It reframes the conversation from “what do you want next year” to “here is what you lose by default,” and business partnering conducted from a baseline produces different answers than business partnering conducted from a blank form.
That single change is what separates a demand forecast from a wish list. Headcount planning collects requests. Demand translation interrogates them.
Artifact: a demand forecast by capability and by quarter. Owner: the business unit leader, facilitated by HR. Elapsed: 2 weeks.
4
Step 4: Size and Rank the Gaps
Apply the two-axis ranking: business impact if unfilled, against market scarcity. Then cap the strategic list at ten roles, whatever the analysis surfaced.
The cap is not a simplification. It is the mechanism that keeps the plan alive, because a longer list guarantees abandonment and everything below the cap can be managed operationally without any loss.
Ten roles is also where the concentration evidence points. If 5% of roles carry 95% of business impact, your strategic list was always going to be short, and talent risk that matters concentrates in a handful of places you can name.
Artifact: a ranked gap register with a named top ten. Owner: HR, validated with the business unit leader. Elapsed: 1 week.
⚠ WATCH OUT
Anti-pattern: the sixty-entry gap register. It looks thorough, it survives review because nobody can argue with completeness, and it gets filed within a month because no human being can act on sixty priorities.
Ranking is the value you add. Handing leadership an unranked list is handing back the hardest part of the job with a covering note.
5
Step 5: Choose Build, Buy, Borrow, or Automate
For each of the top ten gaps, run the four-option test and record the decision with its reasoning and its cost estimate attached.
The reasoning is the durable part. When the plan gets challenged in month seven, the decision log is what survives the challenge, because a decision with its logic attached can be defended or revised deliberately. A decision without it gets relitigated from scratch every quarter.
Build vs buy talent decisions produce measurable outcomes when they are logged. Making these calls deliberately across a senior engineering population cut agency reliance by roughly 60% to 70% in my own function, with four of six senior roles filled without an agency at all, and roughly $9,500 to $12,000 in fees avoided on each of those four. The contingent workforce option was chosen in that set too, on the roles where the horizon was genuinely short.
Artifact: a decision log, one row per strategic gap:
- Capability and the business consequence if unfilled
- Option chosen: build, buy, borrow, or automate
- The reasoning, in two sentences
- Cost estimate and lead time assumed
- The assumption that would invalidate the choice
Owner: HR with finance sign-off. Elapsed: 1 to 2 weeks.
6
Step 6: Cost the Plan and Take It to Finance
Convert the decision log into a cost envelope and take it into the budget cycle, not after it.
Present three scenarios: base, constrained, and accelerated. Each one carries its stated consequence. A single number invites a haircut, and three scenarios invite a choice.
A single number invites a haircut. Three scenarios invite a choice.
HR budget planning done this way moves the accountability for a cut onto the person making it. Finance can still take fifteen percent out, and now the consequence of taking it is written down next to the decision.
Artifact: a costed plan with three scenarios and the consequence of each. Owner: HR and FP&A jointly. Elapsed: 2 weeks, timed to the finance calendar.
◆ FROM THE LAB
Real implementation: the reception you get in a budget meeting depends on whether you have moved a number before. When I walked in having taken cost per hire on senior engineering roles from roughly $7,800 to $9,000 down to roughly $3,600 to $4,600, and time to fill from 70 to 80 days down to 45 to 50, the conversation changed shape.
Not because the numbers were spectacular. Because they were mine, they were measured, and they meant the scenarios I was presenting had been built by someone who had been held to a forecast before. Bring one proven improvement into the room and the rest of the plan inherits its credibility.
7
Step 7: Set the Re-Forecast Rhythm
A plan without a review cadence is a document. Define the operating rhythm before the plan is published, never after it starts slipping.
- Monthly operational review of the rolling 12-month layer
- Quarterly re-forecast of the strategic layer
- Event-driven triggers that force an off-cycle re-forecast
- A named owner against every one of those, published with the plan
Governance is designed before execution starts. On the high-volume campaign, that meant daily recruiter stand-ups, real-time tracker dashboards, and weekly hiring war-room calls with hiring managers. Strategic planning runs at a slower clock, and the principle carries over intact: the rhythm exists so deviation becomes visible before it becomes expensive.
This is the step most teams skip, and skipping it is what decides whether the plan survives to month twelve. Your HR operating model either has a slot for this review or it does not.
Artifact: a published review calendar with named owners. Owner: HR. Elapsed: half a week.
⚠ WATCH OUT
Common mistake: treating Step 7 as administrative tidy-up and dropping it when the cycle runs long. It is the cheapest step in the blueprint at half a week, and it is the only one that determines whether the other six get used again.
A plan with no calendar attached has an expiry date of roughly five months, at which point nobody can say whether it is on track.
How to Forecast Demand for Workforce Planning When the Business Will Not Give You Numbers
Every guide tells you to align the workforce plan with business strategy. None of them address the situation you are in, which is that the business either has no numbers, will not commit to the numbers it has, or changes them in April.
Start by reframing why. Business leaders do not withhold headcount numbers out of obstruction.
They withhold them because committing to a number in March that will be judged in December is a career risk with no upside attached. Once you see the incentive, the method follows.
◆ FROM THE LAB
The Sofia lens: I spent two planning cycles escalating non-responses before I understood what I was looking at. The forms were not being ignored. They were being avoided, deliberately and rationally, by people who knew a number on paper in Q1 becomes a stick in Q4.
The moment I stopped asking for a commitment and started asking for constraints, the same leaders talked freely for an hour. Nobody is protecting the information. They are protecting themselves from the format you asked for it in.
How to execute:
Stop asking how many people they need. Ask three questions that are safe to answer:
- What are you committed to delivering over the next eighteen months?
- What would have to be true for that delivery to happen?
- If you had to choose, what would you stop doing?
Those three answers convert into capability demand without anyone committing to a headcount. Commitments give you the capability list. Constraints give you the sequence. What they would stop doing gives you the priority ranking you would otherwise have to guess at.
Convert the answers into a range, never a point estimate. A band with its assumptions written underneath is more useful to a CFO than a single number with none.
The Old Way
- Send the headcount request form
- Chase it twice
- Escalate when it is not returned
- Conclude that planning is impossible here
The Lab Way
- Ask three questions nobody is afraid to answer
- Build the forecast from commitments and constraints
- Publish a band with its assumptions attached
- Let the business correct a draft it did not have to write
Intelligence-Led Sourcing is what lets you walk into that conversation holding something. When talent acquisition maintains continuous market mapping, HR can put supply reality on the table before the business puts a demand number on it, which inverts the whole dynamic.
Talent market intelligence is a standing capability in that model, not a study you commission. I have measured its output twice: running competition analysis before a search improved Quality of Hire by 12%, and building a talent landscape view across similar industries improved it by 14%. Neither was a one-off project. Both were continuous work that happened to be measurable.
Four demand signals exist independently of any leader’s cooperation, and you can build a forecast from them this month:
- The sales pipeline and its historical conversion rate, which implies delivery capacity
- Attrition trend by team, which implies replacement demand whether or not the business grows
- Overtime, contractor spend, and open requisition aging, which say demand already exceeds supply today
- Product and project roadmaps, which name capabilities even when they name no headcount
Together those four produce a defensible demand band. Recruitment forecasting built this way is not a workaround. It is a better input than a number somebody guessed at under pressure, because every component of it is observed rather than predicted.
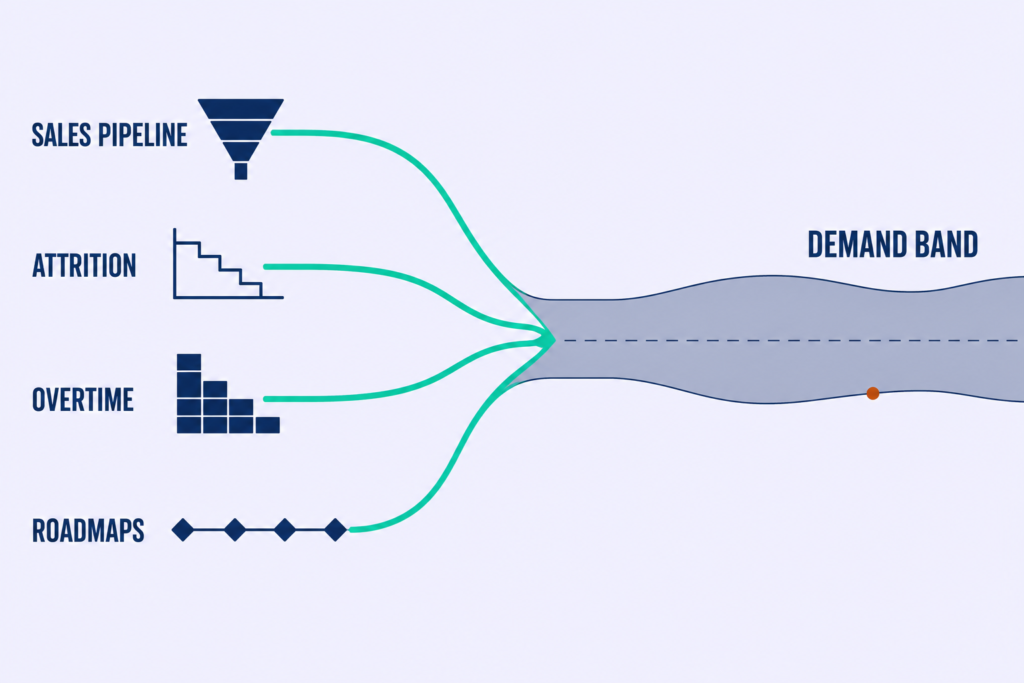
Then run the escalation that works. Present your forecast as a draft and let the business correct it.
People who will not produce a number will readily correct one.
At the far end of this sits Talent Market Pre-Alignment, which stops the forecast being a purely analytical exercise. Identify and engage capability ahead of demand through targeted competitions, challenges, and pre-built pools, so interest and availability are settled before the requisition opens.
The method produces three effects, and the third one is the reason it belongs in a planning guide rather than a sourcing guide. Time-to-hire improves. Quality of Hire improves. Forecasting accuracy improves, because a talent pipeline you have already spoken to is a supply estimate with evidence behind it.
◆ PRO TIP
Pro tip: publish the draft forecast with a named correction deadline and circulate it to every business leader at once. Correction beats request because it costs the leader nothing to disagree, and disagreement gives you the number you were asking for in the first place.
Send it to one leader privately and you get silence. Send it to six at once with their peers copied and you get answers within the week.
Build, Buy, Borrow, or Automate: How to Close the Workforce Planning Gap
Most guides name build, buy, and borrow as a concept and give it three sentences. Nobody gives you the cost comparison, the lead-time comparison, or the conditions under which each option fails.
Here’s the deal:
Each option below carries a decision rule, its real economics, and the failure mode that shows up six months in. These are the numbers that make a workforce planning conversation legible to a CFO.
Build: Develop the Capability Internally
Build when three conditions hold together: you have nine months or more of lead time, the capability is differentiating and not generic, and you have an internal population holding adjacent skills.
Internal development is not free, and pretending otherwise is how the option loses credibility with finance. You are paying for six to twelve months of partial productivity, plus the retention risk that comes with training someone into a more marketable profile.
The mitigation is structural. Build against capabilities the external market also values, and pair the development with a defined internal move on completion. Upskilling with no destination attached is an attrition programme with a training budget.
Internal mobility is where the investment lands, which is why the First Look Policy matters here as much as it did in the benefits section. A 23% internal hire rate means a build strategy has somewhere to go, and Time-to-Productivity of 28 days internal against 67 days external is the payoff that makes the wait worth it.
◆ PRO TIP
The honest downside: you are making someone more marketable, and some of them will leave with the capability you paid for. That is the actual cost of the build option and it belongs in the decision log, stated plainly.
The organizations that lose least are the ones where the promotion arrives with the capability. Development that ends in a title change and a scope change converts the investment into retention. Development that ends in a certificate converts it into a stronger resume.
Buy: Hire From the External Market
Buy when the capability does not exist internally in any adjacent form, the market holds supply at a price you can defend, and you have enough lead time to run a planned search.
The cost gap between planned and urgent is the number worth memorizing. An urgent search carries recruitment agency fees of roughly $9,500 to $12,000 per hire on a $54,000 to $60,000 total compensation package. A planned direct search on the same population ran at roughly $3,600 to $4,600 in my own function, against $7,800 to $9,000 before we changed how the searches started.
Buying well depends almost entirely on the pool. Which is why capability-signal sourcing outperforms keyword sourcing, and why skills-based hiring is an economic argument before it is an ethical one.
◆ FROM THE LAB
My experience: we needed a manufacturing systems analyst, which sounds like a routine search until you run it. Traditional sourcing against the job description produced 14 qualified resumes, and none of them made anyone in the room enthusiastic.
So we inverted the funnel. Instead of filtering on titles and degrees, we searched on capability signals: evidence of PLC programming projects, lean manufacturing case studies, anyone who had documented shop-floor process work in public. We were looking for proof of the work, not proof of the credential.
That search surfaced 62 candidates. The person we hired was a former factory-floor supervisor who had taught himself Python to fix problems nobody had assigned him. He would not have passed a resume screen at any stage of the conventional process.
He now leads digital transformation work for that organization.
The lesson has stayed with me through every search since: credential gatekeeping eliminates your best candidates before you ever meet them, and it does it silently, which is why nobody notices the cost.

The Old Way
- Post the role and wait
- Screen the resumes that arrived
- Filter on titles, employers, and degrees
- Hire the best of what showed up
- Pay an agency when nothing showed up
The Lab Way
- Build the pool before the requisition exists
- Filter on capability signals and project evidence
- Treat portfolios and published work as primary data
- Choose from a pool you widened deliberately
- Use agencies for genuine surprises, not for every search
Passive candidate sourcing run continuously is what made the economics work at function level. Agency reliance fell by roughly 60% to 70%, with four of six senior roles filled without an agency involved at any stage.
Borrow: Contract, Contingent, and Partner Capacity
Borrow when the demand signal is uncertain, when the horizon runs under six months, or when the capability serves a defined project and not a permanent function.
Be honest about the trade-off in the decision log. Contingent workforce capacity is faster and reversible, and it costs more per unit of output while taking institutional knowledge with it on exit. It is a flexibility purchase, never a cost-saving one.
Borrowing extends past contractors, and the version most organizations run badly is the borrowed network: your employee referral program. The standard design assumes referrals are democratic, so the programme gets an all-staff email and a flat bonus.
Referrals are not democratic. Somewhere between 5% and 10% of your employees generate the large majority of successful referrals, and campaigning to the many is effort spent reaching people who were never going to refer anyone.
◆ FROM THE LAB
Real implementation: our referral programme was underperforming in the way these programmes usually do. Volume looked acceptable on a dashboard, conversion was poor, and the same handful of names kept appearing as referrers while everyone else ignored the emails.
So we stopped campaigning to everyone. We pulled the data, identified the top 5% to 10% of referrers by historical conversion, and gave them something the flat bonus never offered: Talent Scout status, VIP perks, and a standing quarterly meeting where they heard what we were hiring for before anyone else did.
One senior engineer in that group referred 11 people. Nine were hired. Eight were still with the organization when I last checked.
The programme ran at 82% conversion against a company average of 31%, and it avoided approximately $48,000 in agency fees over the period. The lesson: democratic referral programmes underperform, and power-user activation works because the people who refer well are doing something other people cannot simply be incentivized into.
⚠ WATCH OUT
Watch out: knowledge leaves with the contractor, and it leaves on the last day of the engagement whether or not you are ready.
Define the handover before the engagement starts, not in the final fortnight. Named internal counterpart, documentation standard, and a shadowing period written into the statement of work. Every organization that skipped this step has re-hired the same contractor at a higher rate to explain what they built.
Automate: Remove the Need for the Role
Automate when the work is high-volume and low-judgment, when the process is stable enough to encode, and when you can name the human checkpoint that stays in place.
My position on AI in recruitment has not moved in three years of running it: AI is a co-pilot, not a decision-maker. It absorbs the high-volume, low-judgment work, and that is where its value sits.
Scheduling. CV parsing. Talent rediscovery inside a database nobody has searched properly in two years. Market mapping. Compliance workflow. Recruitment automation across those five creates capacity for the work recruiters are uniquely good at, which is judgment, relationships, and reading a team well enough to know who will survive in it.
Where the technology is heading is worth naming, because it changes what you plan for. Sourcing co-pilots running semantic search across existing databases. Agentic orchestration managing the whole interview lifecycle past simple scheduling. Skills-first hiring assessed on verified competencies. Predictive analytics that forecast who is likely to leave, not only who needs to be hired.
AI does not replace recruiters. It replaces the parts of the job that stopped recruiters from being effective in the first place.
The planning implication is specific, and it is where most automation business cases go wrong. Automation rarely removes a headcount line. It changes what that headcount does.
So record a capability shift in the plan, not a reduction. The role becomes a talent advisor instead of a process manager, the capability requirement changes, and the headcount stays where it was.
◆ PRO TIP
Real talk: if you promise leadership a headcount saving from automation, you will spend next year explaining why the work reappeared somewhere else. It usually does.
Promise redeployed capacity and a measurable throughput gain, both of which you can evidence. That is a smaller claim and a survivable one, and it keeps the automation budget alive for a second round.
⚠ WATCH OUT
Red flag: algorithmic bias from flawed training data. A model trained on your historical hiring decisions will reproduce your historical hiring prejudices with more consistency than any human panel managed.
There is a second dependency risk alongside it. Teams that route everything through automation lose the personal contact that made candidates say yes, and the drop shows up in acceptance rates before it shows up anywhere else.
Several US jurisdictions regulate automated employment decision tools, including New York City under Local Law 144, and bias-audit or notification obligations may apply depending on where you hire. Involve your legal counsel before deploying any tool that scores or ranks candidates.
Strategic Workforce Planning vs. Operational Workforce Planning
Strategic workforce planning is the 18-month to 5-year capability forecast that decides what the organization will be able to do. Operational workforce planning is the 0 to 12-month plan that covers known requisitions, backfills, and attrition replacement. One asks whether you will have what the business needs. The other asks whether you can cover the work in front of you.
Searchers looking for “strategic workplace planning” land on the same discipline, and the comparison below answers both spellings.
Here’s the difference:
| Dimension | Operational Workforce Planning | Strategic Workforce Planning |
|---|---|---|
| Horizon | 0 to 12 months | 18 months to 5 years |
| Unit of planning | Job titles and headcount | Capabilities and scenarios |
| Primary question | Can we cover the work? | Will we have what the business needs? |
| Data sources | Internal HRIS and ATS data | External labor market data plus business strategy |
| Owner | HR and line managers | HR and the executive team |
| Review cadence | Monthly | Quarterly |
Both modes are legitimate and both are necessary. The strategic one is the one that quietly disappears.
It disappears because operational pressure is immediate and strategic consequence is deferred. Next month’s three backfills will always feel more urgent than a capability gap in 2028, and in a shared hour the urgent item wins every time without anyone deciding that it should.
The fix is structural, not motivational. Separate the two into different meetings, with different owners and different cadences, and protect the strategic review by making it a forum where backfills are out of scope.
Both modes done well look completely different in practice. The operational archetype from my own experience is a high-volume campaign: 420-plus hires in 10 weeks, daily stand-ups, weekly war-rooms, and a tracker everyone could see. The strategic archetype is mapping twelve companies across an industry before a single job description existed. Neither method would survive being used for the other job, and headcount planning collapses them at its peril.
⚠ WATCH OUT
Common mistake: one workforce planning meeting covering both modes. The agenda opens with strategy and closes with three escalations about roles that should have been filled in June.
Nobody in that room is behaving badly. The structure is doing it to them, and the only reliable fix is two calendar invitations with two different owners.
How to Sync Your Workforce Planning Cycle to the Finance Calendar
Most workforce plans are finished after the budget is set. That single timing failure converts the plan from an input into a description of a decision somebody else already made.
The fix is arithmetic. Find the date FP&A needs headcount inputs, then work backwards through the blueprint’s elapsed times.
- Identify the FP&A submission date. For most US organizations on a calendar fiscal year, that lands in late Q3 for the following year.
- Subtract the 10 to 12 weeks the workforce planning process takes, which puts your start in early Q3.
- Put that start date in the calendar as a recurring commitment with an owner attached.
- On a non-calendar fiscal year, run the same subtraction from your own submission date. The arithmetic does not change, only the month does.
- On rolling forecasts, anchor the strategic re-forecast to the quarter-end review rather than to an annual date.
The plan being late is almost never a capability problem. It is a scheduling problem, and scheduling problems have calendar fixes.
◆ FROM THE LAB
Real implementation: the discipline that makes this work is one I learned running high-volume hiring against a fixed business date. We mapped weekly hiring targets backward from the day the business needed people productive, then forecast recruiter bandwidth, interviewer availability, and sourcing throughput against those weekly targets.
Working forward from capacity would have produced a plausible schedule that missed the date by a month. Working backward from the date told us in week one that we were short on interviewer capacity, which was a problem we could still solve.
Same discipline, different clock. Your fixed date is the FP&A submission, and HR budget planning that starts when HR has bandwidth will meet that date by accident at best.
How to execute:
Arriving on time is half the job. The other half is arriving in the right units, because finance does not plan in headcount. Finance plans in cost, timing, and risk.
- Headcount becomes fully-loaded cost phased by start month. A role starting in October costs a quarter of what the same role costs starting in January.
- Time-to-fill becomes the delay between approval and cost recognition.
- Attrition becomes a cost variance against the phasing you submitted.
- Vacancy becomes foregone output, which is the translation that lands hardest.
The $500-a-day figure from the opening of this guide is the model for that last translation. One senior engineering vacancy, sixty days, $30,000 of foregone output. Cost per hire and the rest of the HR metrics that matter all convert the same way once you know the pattern.
Three sentences worth saying verbatim in a budget conversation: “Here is the phased cost, by month, under three scenarios.” “A four-week approval delay on this role moves $10,000 of cost into next year and $20,000 of output out of this one.” “If this gets cut, here is the specific capability the business will not have in Q3.”
◆ PRO TIP
Pro tip: bring the phased hiring curve. It is the one artifact finance always wants from HR and almost never receives, because HR arrives with an annual total.
A curve showing hires by month, with loaded cost attached to each month, turns a headcount request into a cash-flow document. Hand a CFO a cash-flow document and you have changed which side of the table you are sitting on.
Workforce Planning Models, Tools, and Technology
Four models are worth knowing. Each one earns its complexity under specific conditions and fails under others, and choosing between them on sophistication is how teams end up staffing a project around a method they did not need.
Why this works:
| Model | What It Does | When It Earns Its Complexity | Failure Mode |
|---|---|---|---|
| Trend and ratio forecasting | Projects demand from historical ratios of headcount to revenue, volume, or output | First cycle, and any population with stable work patterns | Breaks when the business model changes, which it announces loudly |
| Scenario planning | Models capability need under two or three defined business futures | The ranked top ten roles, where being wrong is expensive | Seven scenarios instead of three, which is avoidance dressed as rigour |
| Strategic workforce segmentation | Separates roles by business impact so planning effort concentrates | Always. This is where most of the value sits | Segments defined once and never revisited as the business changes |
| The 9-box grid | Plots performance against potential for succession decisions | Succession planning conversations with calibrated ratings | Used as a planning tool, with ratings nobody calibrated |
Scenario planning is the most valuable of the four and the most abused. Three scenarios force a decision. Seven scenarios are a way of avoiding one while looking thorough.
The 9-box grid deserves its own warning. It is a succession tool that gets misapplied as a planning tool, and its output is only ever as good as the calibration behind the ratings, which in most organizations is not good at all.
◆ PRO TIP
Real talk: trend and ratio forecasting is unfashionable, takes an afternoon, and is right often enough that most teams should start there and stop worrying about the rest.
Nobody builds a reputation on it, which is the only real argument against it. Run it in cycle one, find out where it breaks, and let the breakage tell you which sophisticated model you need.
Tooling follows the same logic, and the sequence matters more than the selection. Most teams need, in order: a clean HRIS record, a spreadsheet model they fully understand, a reporting layer, and only then dedicated planning software.
If you cannot articulate your planning logic in a spreadsheet, buying a planning platform will encode your confusion at speed.
Think in categories, not vendors, when you build the HR tech stack for this: an HRIS holds the record, people analytics tools report on it, workforce planning platforms model forward from it, and labor market data providers tell you what exists outside it. Four categories, four different problems, and no single product that genuinely covers all of them.
Ask any vendor two questions before you get to price:
- What data does this need that we do not currently have?
- Who maintains the model after the implementation team leaves?
The second question has ended more procurement conversations for me than any pricing discussion.
◆ FROM THE LAB
My experience: two verdicts I will stand behind, because I have run both at enterprise scale.
Avature is extremely powerful and deeply customizable. It is a platform, not a plug-and-play ATS, and treating it as the latter is how implementations go wrong. Right for enterprise or global talent acquisition teams with dedicated admins and genuine process maturity. Wrong for lean teams, and wrong for any organization without change-management discipline, where the customization becomes a liability nobody owns.
ChatGPT and Copilot are a genuine productivity multiplier and not a recruiter. Good for role research, market-insight synthesis, drafting, and Boolean construction. Wrong for candidate evaluation and wrong for compliance-sensitive documentation, and the line between those two uses is the line I have watched teams cross without noticing.
Neither verdict is sponsored, and neither tool is a workforce planning platform. They sit adjacent to the plan and make the execution of it faster. Where I have no measured experience with a category, I have said nothing rather than repeat what a vendor told me. AI in recruitment has enough confident opinion in circulation already.
The Metrics That Prove Workforce Planning Worked
Measuring recruitment activity tells you how busy your function was. It says nothing about whether the plan was any good, which is the question you will be asked when you go back for funding.
Five metrics, and only five. A longer list dilutes the argument and nobody reads past row seven.
| Metric | What Good Looks Like | What It Means to Finance |
|---|---|---|
| Forecast accuracy by capability | Planned versus actual hires measured per capability, never as a total. Published with the reason for every miss. Year one is a baseline, not a score. | Whether HR’s numbers can be trusted in next year’s budget |
| Time-to-Fill on top-ten roles | 36 days on engineering roles and 39 days on volume roles were my own achieved benchmarks under planned conditions | The delay between approval and output starting |
| Internal fill rate | 23% under an active First Look Policy with recruiters tapping internal candidates | Capability acquired without external cost, productive in 28 days rather than 67 |
| Cost per hire, planned vs. unplanned | Roughly $3,600 to $4,600 planned, against $7,800 to $9,000 unplanned, on senior engineering roles | The measurable price of hiring under urgency |
| Time-to-Productivity | 28 days for internal moves against 67 days for external hires on comparable roles | When the headcount cost starts producing a return |
Every number in that middle column came from one team under stated conditions. They are achieved benchmarks, not industry standards, and presenting them as targets for a function with different roles and a different market would be the kind of borrowed authority this guide exists to argue against.
◆ FROM THE LAB
The Sofia lens: two more signals I track alongside those five, because they answer questions the first five cannot. An offer acceptance high-water mark of 90%, which tells me whether pre-alignment is working, since pre-aligned candidates are not being persuaded cold at offer stage.
And a best twelve-month cohort retention rate of 89%, which is the only version of Quality of Hire that finance actually feels. A hire who leaves in month nine was a cost, whatever the scorecard said in week one.
One of those five decides whether you get funded again, and it is not the one recruiters watch. Forecast accuracy is the only metric that scores the plan instead of the hiring, and it is the only one that proves HR’s numbers can be relied on.
Measure it by capability, never by total. A total can be right while every line underneath it is wrong, and that is the most dangerous version of accuracy because it survives a summary slide.
◆ PRO TIP
Real talk: publish forecast accuracy in year one even when it is poor. A published miss with a stated reason builds more credibility than a silent one, because everyone in the room already suspects the first plan was wrong.
“We forecast six and hired nine, because the connected product line moved forward two quarters” is the sentence that gets your next plan taken seriously. Saying nothing is what confirms the suspicion that HR does not track its own accuracy.
Where Workforce Plans Break, and the Re-Forecast Triggers That Catch Plan Failure
Your last plan probably failed. Almost everybody’s did, and the reason matters because failure here has a diagnosable signature.
Five failure modes account for nearly all of it. Each one has an early warning sign you can check this week, which is more useful than a fix you cannot apply retrospectively.
- The demand signal changed and nobody told HR. Warning sign: the plan has no standing slot in the business’s own review rhythm, so changes reach you through gossip.
- The plan was built on a taxonomy nobody outside HR uses. Warning sign: hiring managers restate your capability language in their own words every time you meet.
- The budget was cut by a flat percentage and the logic broke silently. Warning sign: the cut was applied across the board and nobody re-ran the consequences per capability.
- The planner left and the model was in their head. Warning sign: one person can explain how the attrition assumptions were built, and there is no documentation.
- The plan was right and nobody acted on it. Warning sign: no decision rights were attached to any line in the plan, so it advised rather than authorized.
Change management in HR gets blamed for most of these. Four of the five are design faults you can engineer out before publication.
⚠ WATCH OUT
Anti-pattern: the right plan nobody acted on. This is the most demoralizing failure mode because the analysis was sound, the forecast turned out accurate, and the organization still hired reactively all year.
A plan with no decision rights attached is a recommendation. Name, per line, who can approve the hire and who can release the budget, and get that named before the plan is published rather than discovered in month four.
Here’s how to build it:
A quarterly cadence alone is too slow for the events that invalidate a plan. Define six triggers that force an off-cycle re-forecast, and publish them with the plan itself.
- A change in the business plan, or a funding event
- Attrition in any top-ten capability exceeding forecast by a defined margin
- A reorganization, or a change in the executive who owns the demand signal
- A hiring freeze or an unplanned budget change
- Time-to-Fill on a top-ten role exceeding its plan assumption by more than 50%
- The loss of a single point of failure in a top-ten capability
Publishing the list is the payload, and it does something political rather than analytical. Pre-agreeing the triggers removes the cost of revising a plan, because the revision becomes a pre-agreed response to a named event.
When the triggers are published in advance, a revision is the system working. When they are not, a revision is the planner failing.
The operational version of this principle is something I built into every high-volume campaign I ran: real-time tracker dashboards and daily stand-ups existed precisely so deviation became visible before it became expensive. Strategic planning runs slower, and talent risk behaves the same way at either speed. Visibility early is cheap. Visibility late is a recruitment problem you cannot solve inside the quarter.
The Workforce Planning Maturity Ladder
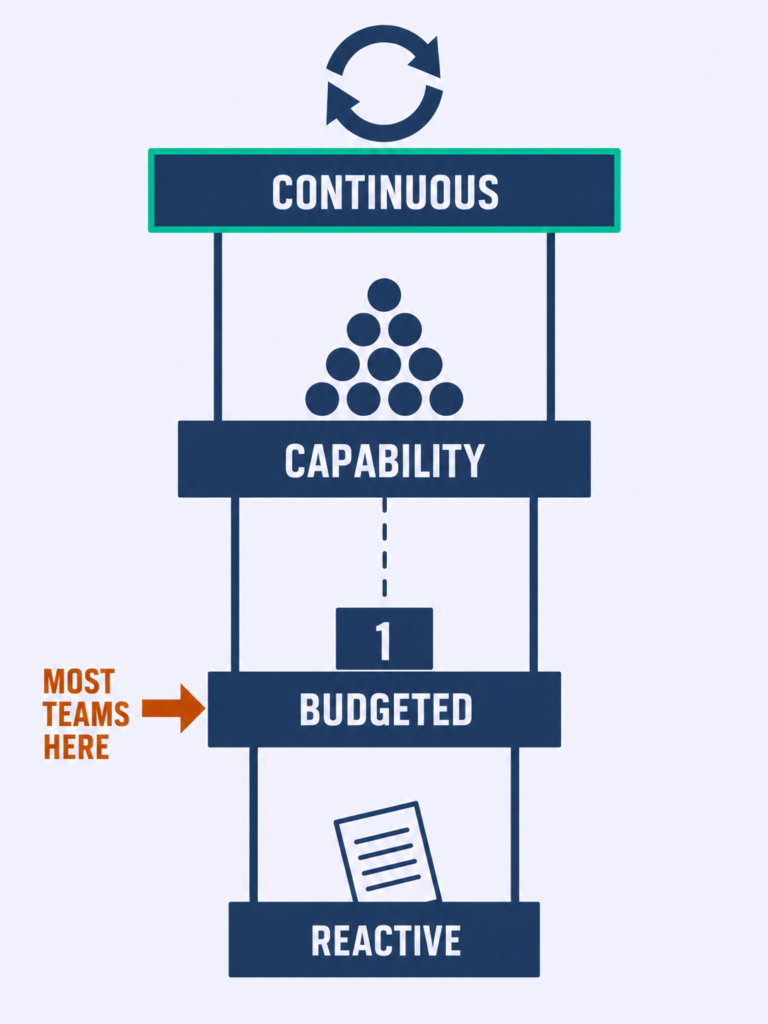
Place yourself on this ladder in thirty seconds, then take the one move that advances you. Not a list of moves. One.
- Stage 1, Reactive. Hiring begins when a resignation lands. There is no plan, only requisitions. The one move: build the attrition model.
- Stage 2, Budgeted. An annual headcount number exists, agreed with finance, unconnected to any capability. The one move: rank the top ten gaps and cap the list there.
- Stage 3, Capability-planned. The ranked top ten are planned at capability level, with a supply baseline and recorded build, buy, borrow, or automate decisions. The one move: publish the trigger list.
- Stage 4, Continuously re-forecast. The plan has a published cadence, pre-agreed triggers, and a measured forecast accuracy leadership trusts.
Stage 3 is the right target for most organizations. Stage 4 costs real operating discipline to maintain, and reaching for it before Stage 3 is stable produces a cadence nobody honours.
◆ FROM THE LAB
The Sofia lens: most organizations are at Stage 2 and believe they are at Stage 3. The tell is the annual number. If a headcount figure was agreed with finance and no capability sits underneath any line of it, that is Stage 2 with a better deck.
The ladder is climbable, and the climb is shorter than it looks. The function I worked in moved from reactive posting to pre-identified pools inside a single planning year, and Time-to-Offer came down from 68 days to 34 as a result. One stage, one year, one measurable outcome.
A mature talent supply chain is what Stage 4 looks like from the outside. Strategic workforce planning at that stage stops being an annual event and becomes the way the function thinks.
Nobody moves two stages in a year. Everybody can move one.
Workforce Planning FAQs
What Are the 5 Steps of Workforce Planning?
The five steps of workforce planning are: set the planning horizon and scope, build the supply baseline with attrition applied, translate business plans into capability demand, size and rank the gaps, then choose whether to build, buy, borrow, or automate each one.
The Lab’s blueprint runs seven steps because costing the plan into the budget cycle and setting the re-forecast rhythm are where most five-step versions fail. The analysis is rarely the problem. The plan arriving after the budget closed, with no review calendar attached, is what kills it.
What Is the Difference Between Workforce Planning and Headcount Planning?
Headcount planning answers how many people the budget allows. Workforce planning answers which capabilities the business will fail without, and where those capabilities will come from. One is a finance output, the other a business-risk output.
Run two questions on your own plan. Opened in month seven after a pivot, does it tell you anything useful, or only what you were allowed to spend? And does it name capabilities, or job titles and a number? A plan that only survives a stable year is a headcount plan with a different cover page.
What Is Strategic Workplace Planning?
Strategic workplace planning is a common variant of strategic workforce planning, and both refer to the same discipline: the 18-month to 5-year capability forecast that sits above operational headcount planning, covering build-versus-buy decisions, location strategy, and succession depth.
The test for whether yours is genuinely strategic is one line long. The plan must contain at least one capability the organization does not have today.
Who Is Responsible for Workforce Planning?
HR owns the model, the supply data, the attrition forecast, and the sourcing plan. The business owns the demand signal. Finance owns the cost envelope and the approval gate. Nobody owns all three, which is why workforce planning fails when it is run as a solo HR exercise.
The most common dysfunction follows from that split: HR is held accountable for a demand number it did not produce and has no standing to challenge. Fixing it starts with making the three-way ownership explicit before the planning cycle opens.
How Often Should a Workforce Plan Be Reviewed?
Review the rolling operational layer monthly and the strategic layer quarterly, plus event-driven re-forecasts triggered by a change in the business plan, a funding event, a reorganization, a hiring freeze, or attrition in a top-ten capability exceeding forecast.
Publish the trigger list alongside the plan. Revision then becomes a pre-agreed response to a named event, which removes the political cost that stops most teams re-forecasting until the plan is visibly broken.
Start Your Workforce Planning Cycle From Knowledge, Not Urgency
Workforce planning is not a forecasting exercise. It is the decision about whether your organization hires from a position of knowledge or a position of urgency, and everything in this guide is downstream of that one choice.
What separates the organizations that execute is not analytical sophistication. It is whether the plan has a calendar, an owner, and a published set of triggers attached to it.
Most teams have a good enough model and no operating rhythm. That is Stage 2, and it is the most comfortable place in the organization to be wrong, because the number exists and nobody checks what sits underneath it.
The unit those numbers are written in is on its way out. Deloitte found that 93% of respondents consider moving away from the job construct important or very important to organizational success, and 81% of business executives say work is increasingly performed across functional boundaries. Translation: the teams building capability-level planning now are the ones who will not be rebuilding their entire planning model in two years.
Source: Deloitte Insights, “From jobs to skills to outcomes: Rethinking how work gets done,” October 2025
So pick three things and run them over the next 90 days. Build the attrition model, segmented by team and tenure. Rank your gaps and cap the strategic list at ten roles. Publish your trigger list alongside whatever plan you already have.
Then measure forecast accuracy by capability at the end of the year and publish the result, whatever it says. That number is the one that gets your plan funded again.
If you are rebuilding your planning cycle this year, I would like to hear how it goes. The failure modes are more interesting than the wins, and I learn more from a plan that broke in month seven than from one that survived a quiet year. Connect with me on LinkedIn and tell me which stage you started from.
